ヘルプ ネットワークメトリック ネットワーク監視
ネットワーク監視のパフォーマンスメトリック
装置のパフォーマンススナップショットは、[監視ステータス]ページで表示できます。
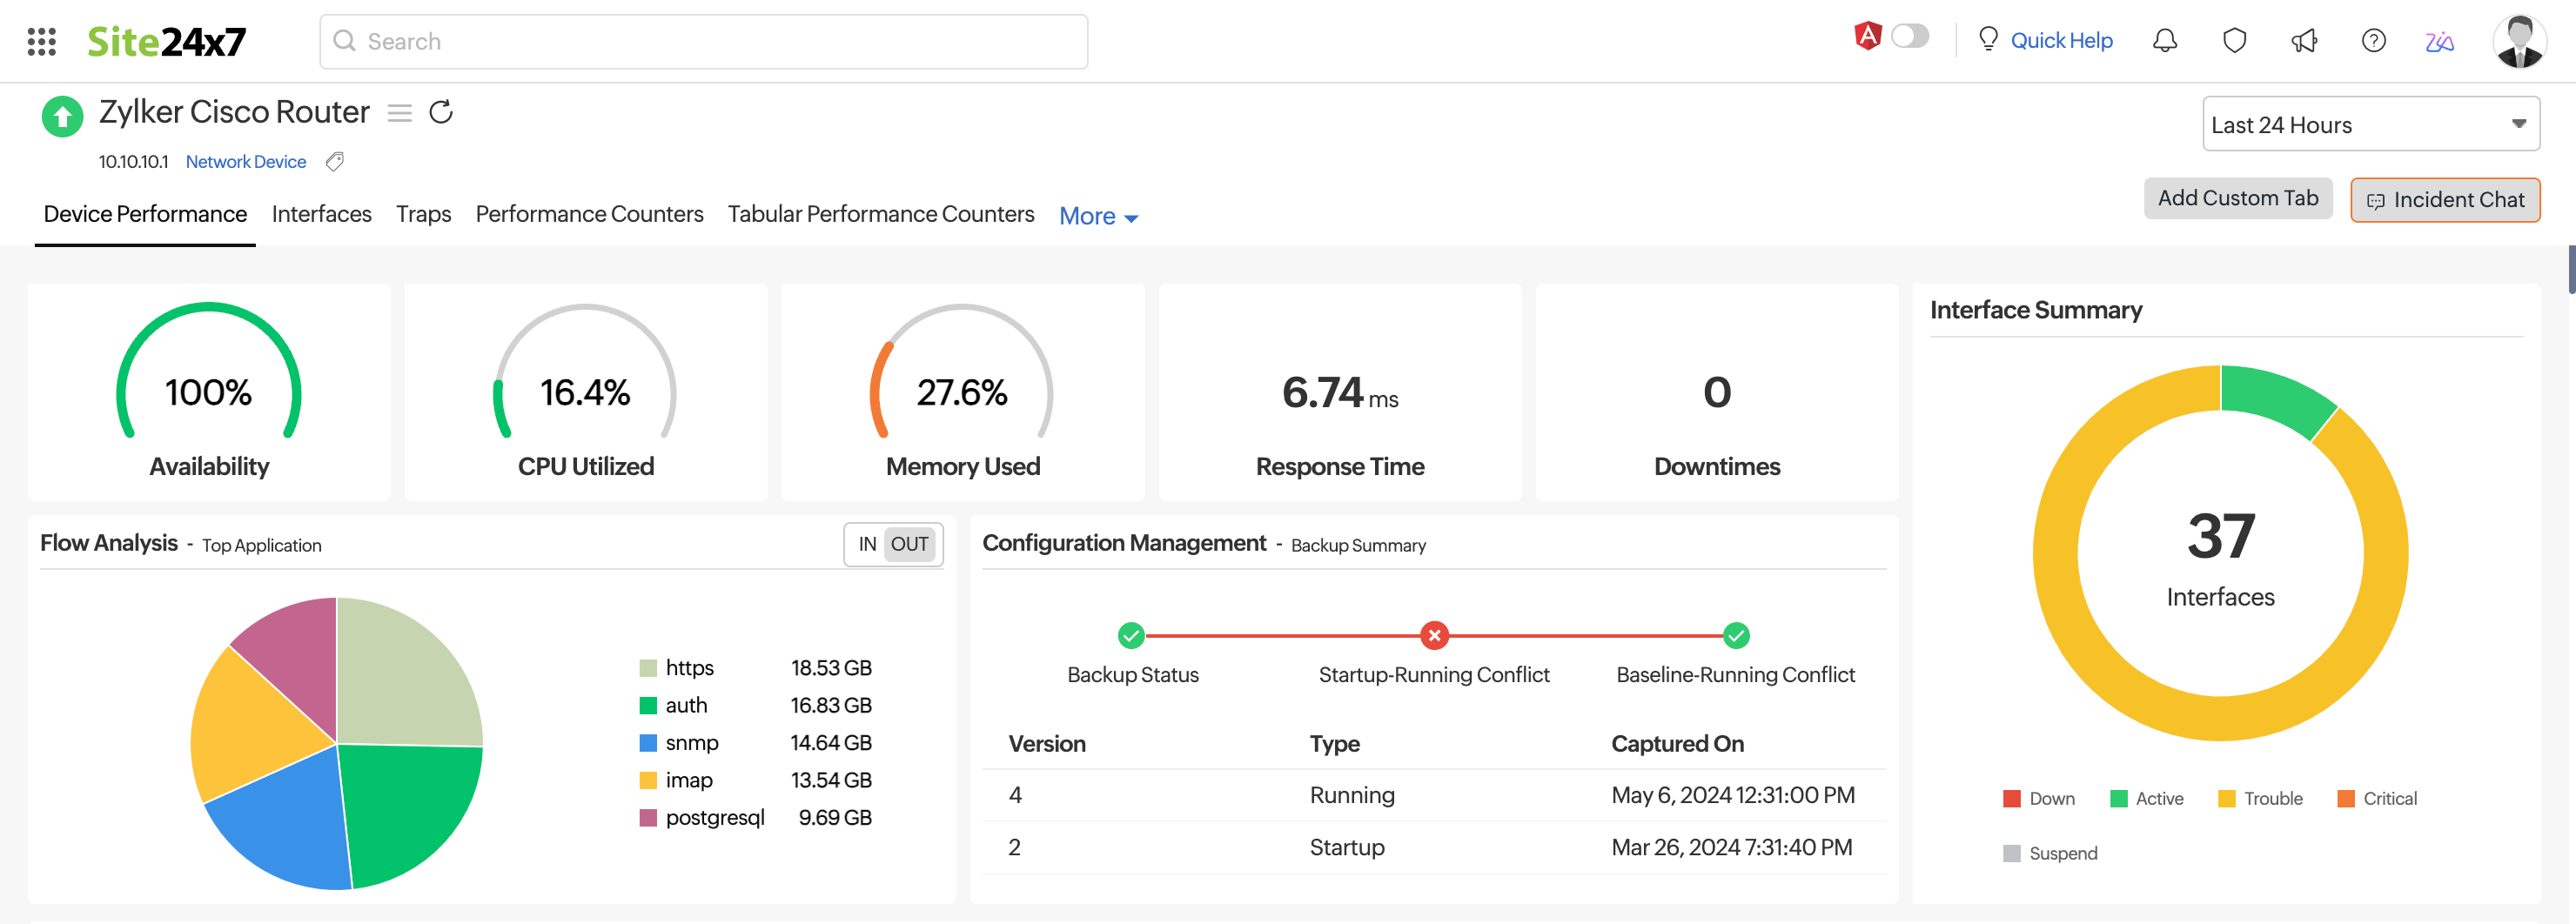
装置パフォーマンス
[ネットワーク装置]ページで装置名をクリックし、表示される最初のタブ(装置パフォーマンス)を開くと、装置の可用性、応答時間、ダウンタイムの詳細を確認できます。
ここでは、可用性、ダウンタイム、イベントタイムライン、更新、応答時間、パケットロス、CPU使用率、メモリ使用率、装置詳細、ハードウェア詳細のウィジェットを表示できます。
CPU使用率とメモリ使用率のパフォーマンスカウンターを設定している場合は、ここで確認できます。装置テンプレートを編集することで、カスタム監視メトリックを表示するように製品を設定することもできます。
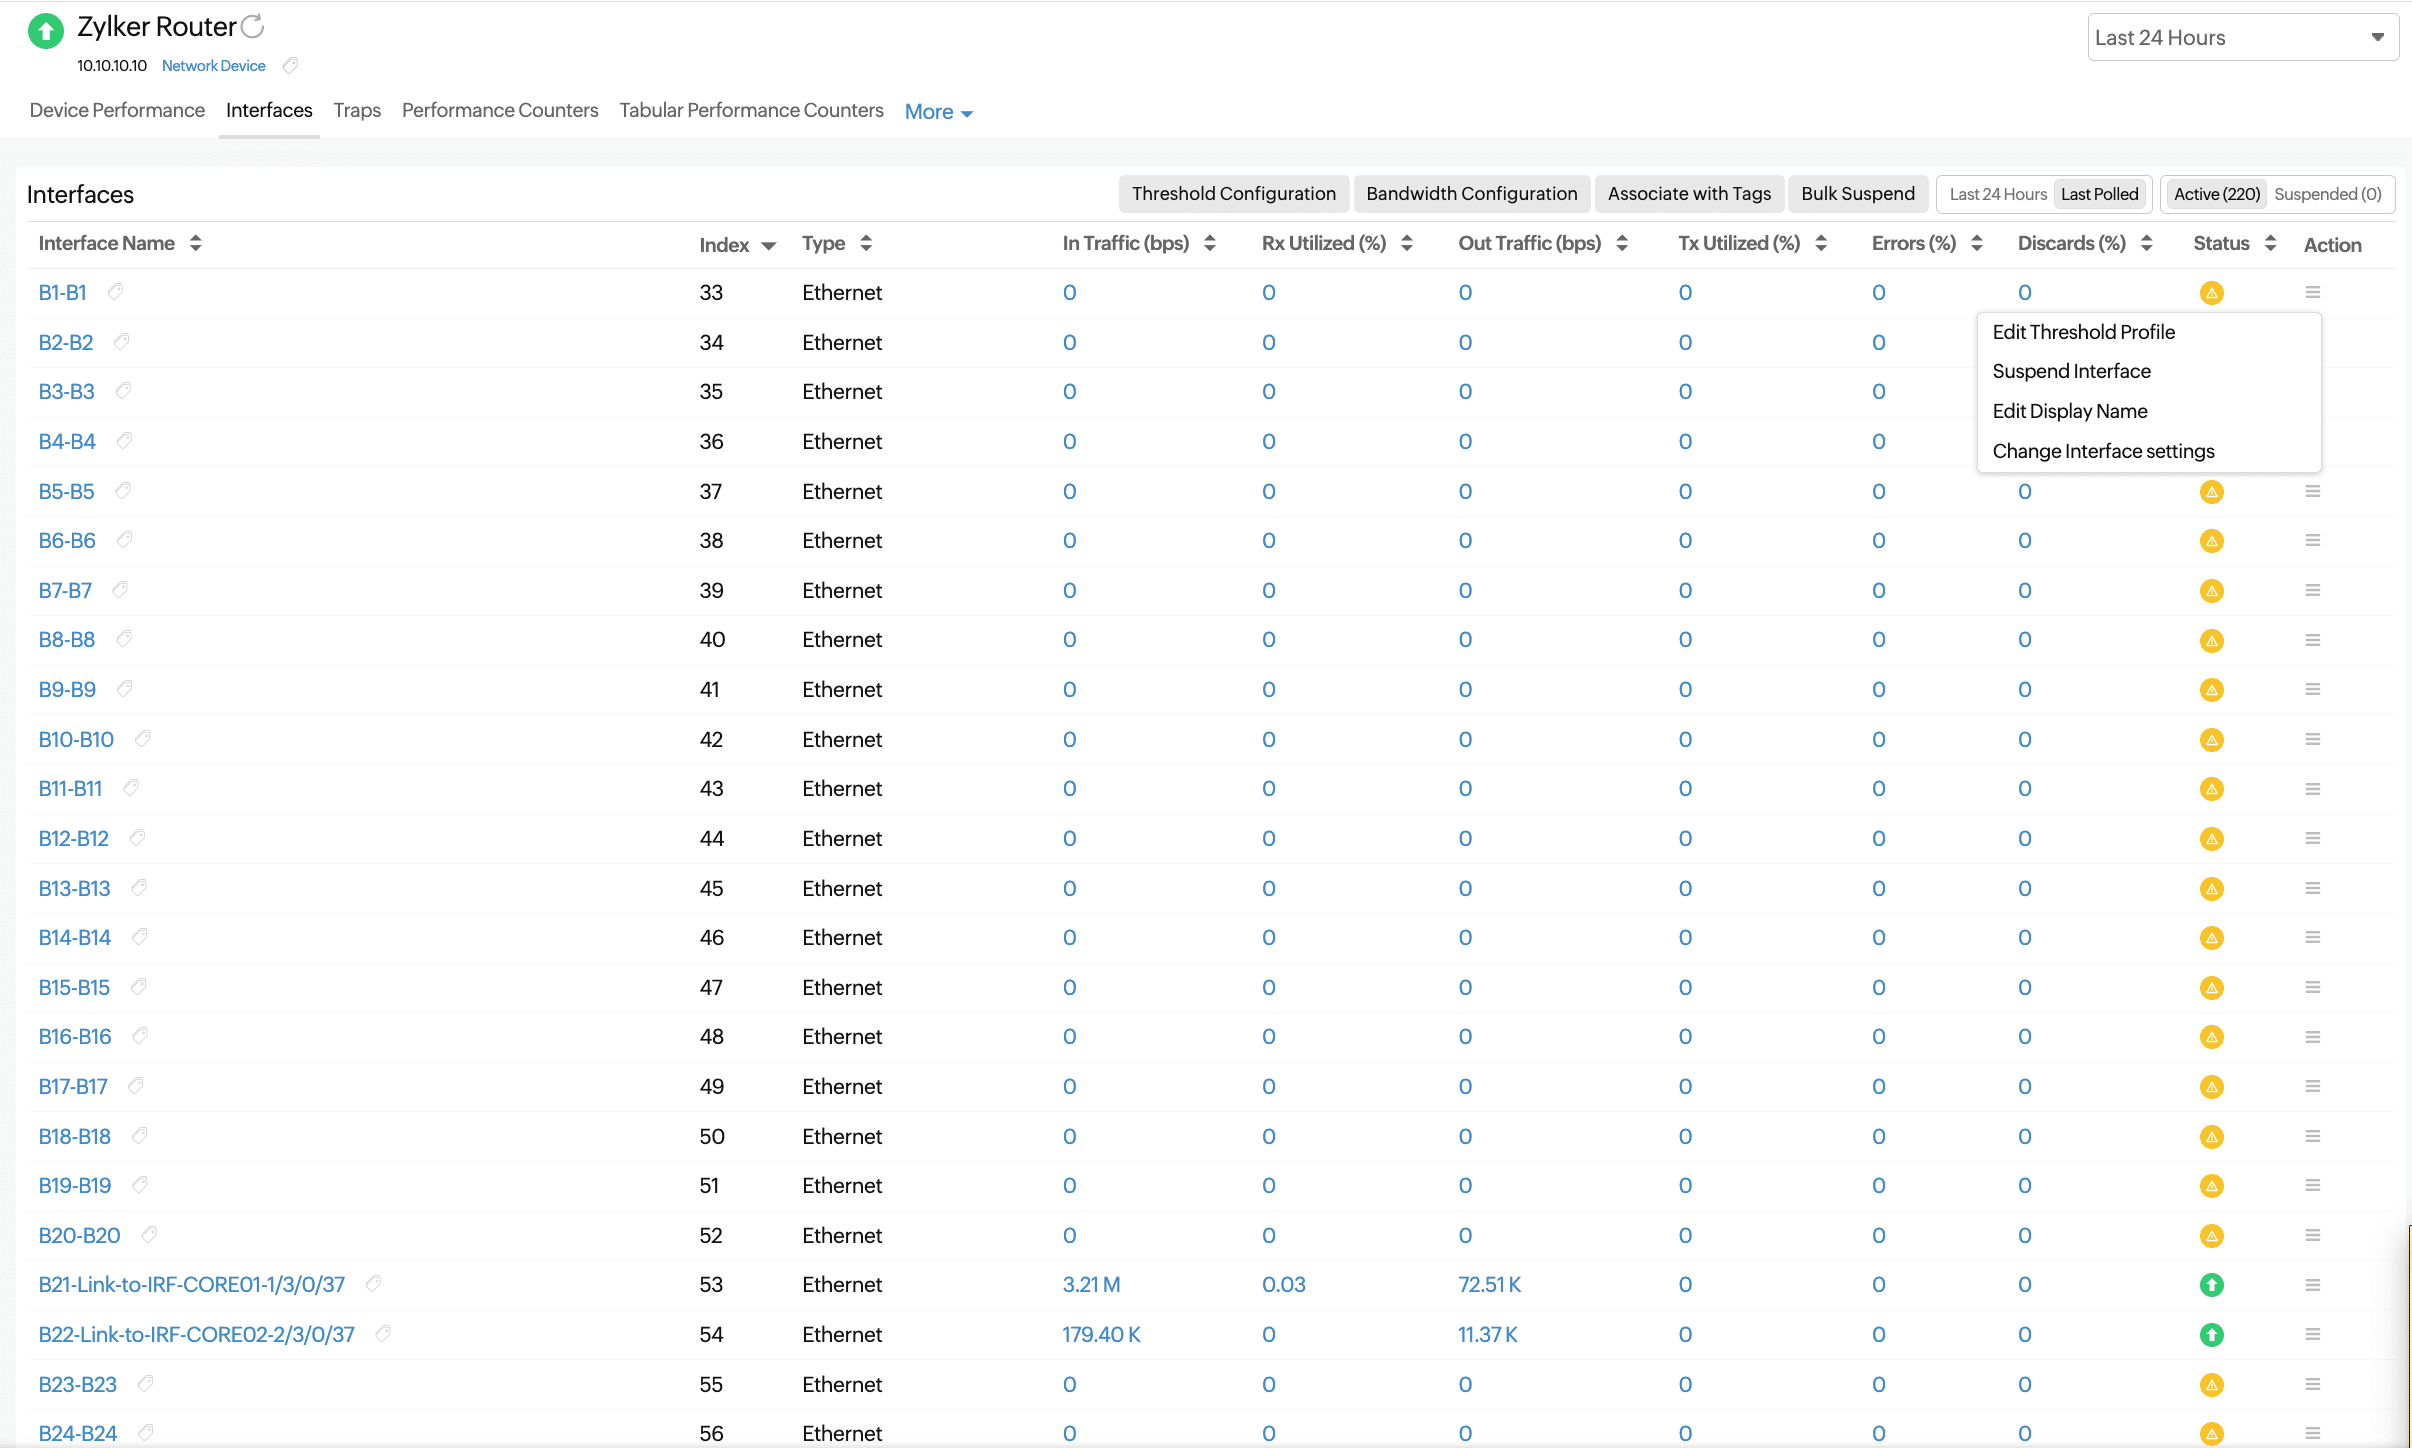
インターフェース
選択したデバイスのインターフェースのリストと、そのステータスおよびその他の詳細が表示されます。インターフェース名をクリックすると、その可用性と、トラフィックおよび帯域幅使用率のグラフが表示されます。
監視されているライセンス付きインターフェース(アクティブインターフェース)と監視されていないライセンスなしインターフェース(一時停止中のインターフェース)を切り替えます。
| パラメーター | 説明 |
|---|---|
| Interface Name | The name of the interface obtained from RFC 1213 |
| Index | The serial port |
| Type | The type of the interface, like ethernet or a VLAN |
| In Traffic (bps) | The amount of traffic received by the interface in bits per second |
| Rx Utilized (%) | The amount of received traffic utilized by the interface as a percentage |
| Out Traffic (bps) | The amount of traffic transmitted by the interface in bits per second |
| Tx Utilized (%) | The amount of transmitted traffic utilized by the interface as a percentage |
| Errors (%) | The percentage of error packets received by the interface |
| Discards (%) | The percentage of packets discarded by the interface (out of the total number of packets) |
| Status | The state of the interface: up, down, or trouble |
| Action | ハンバーガーアイコン( |
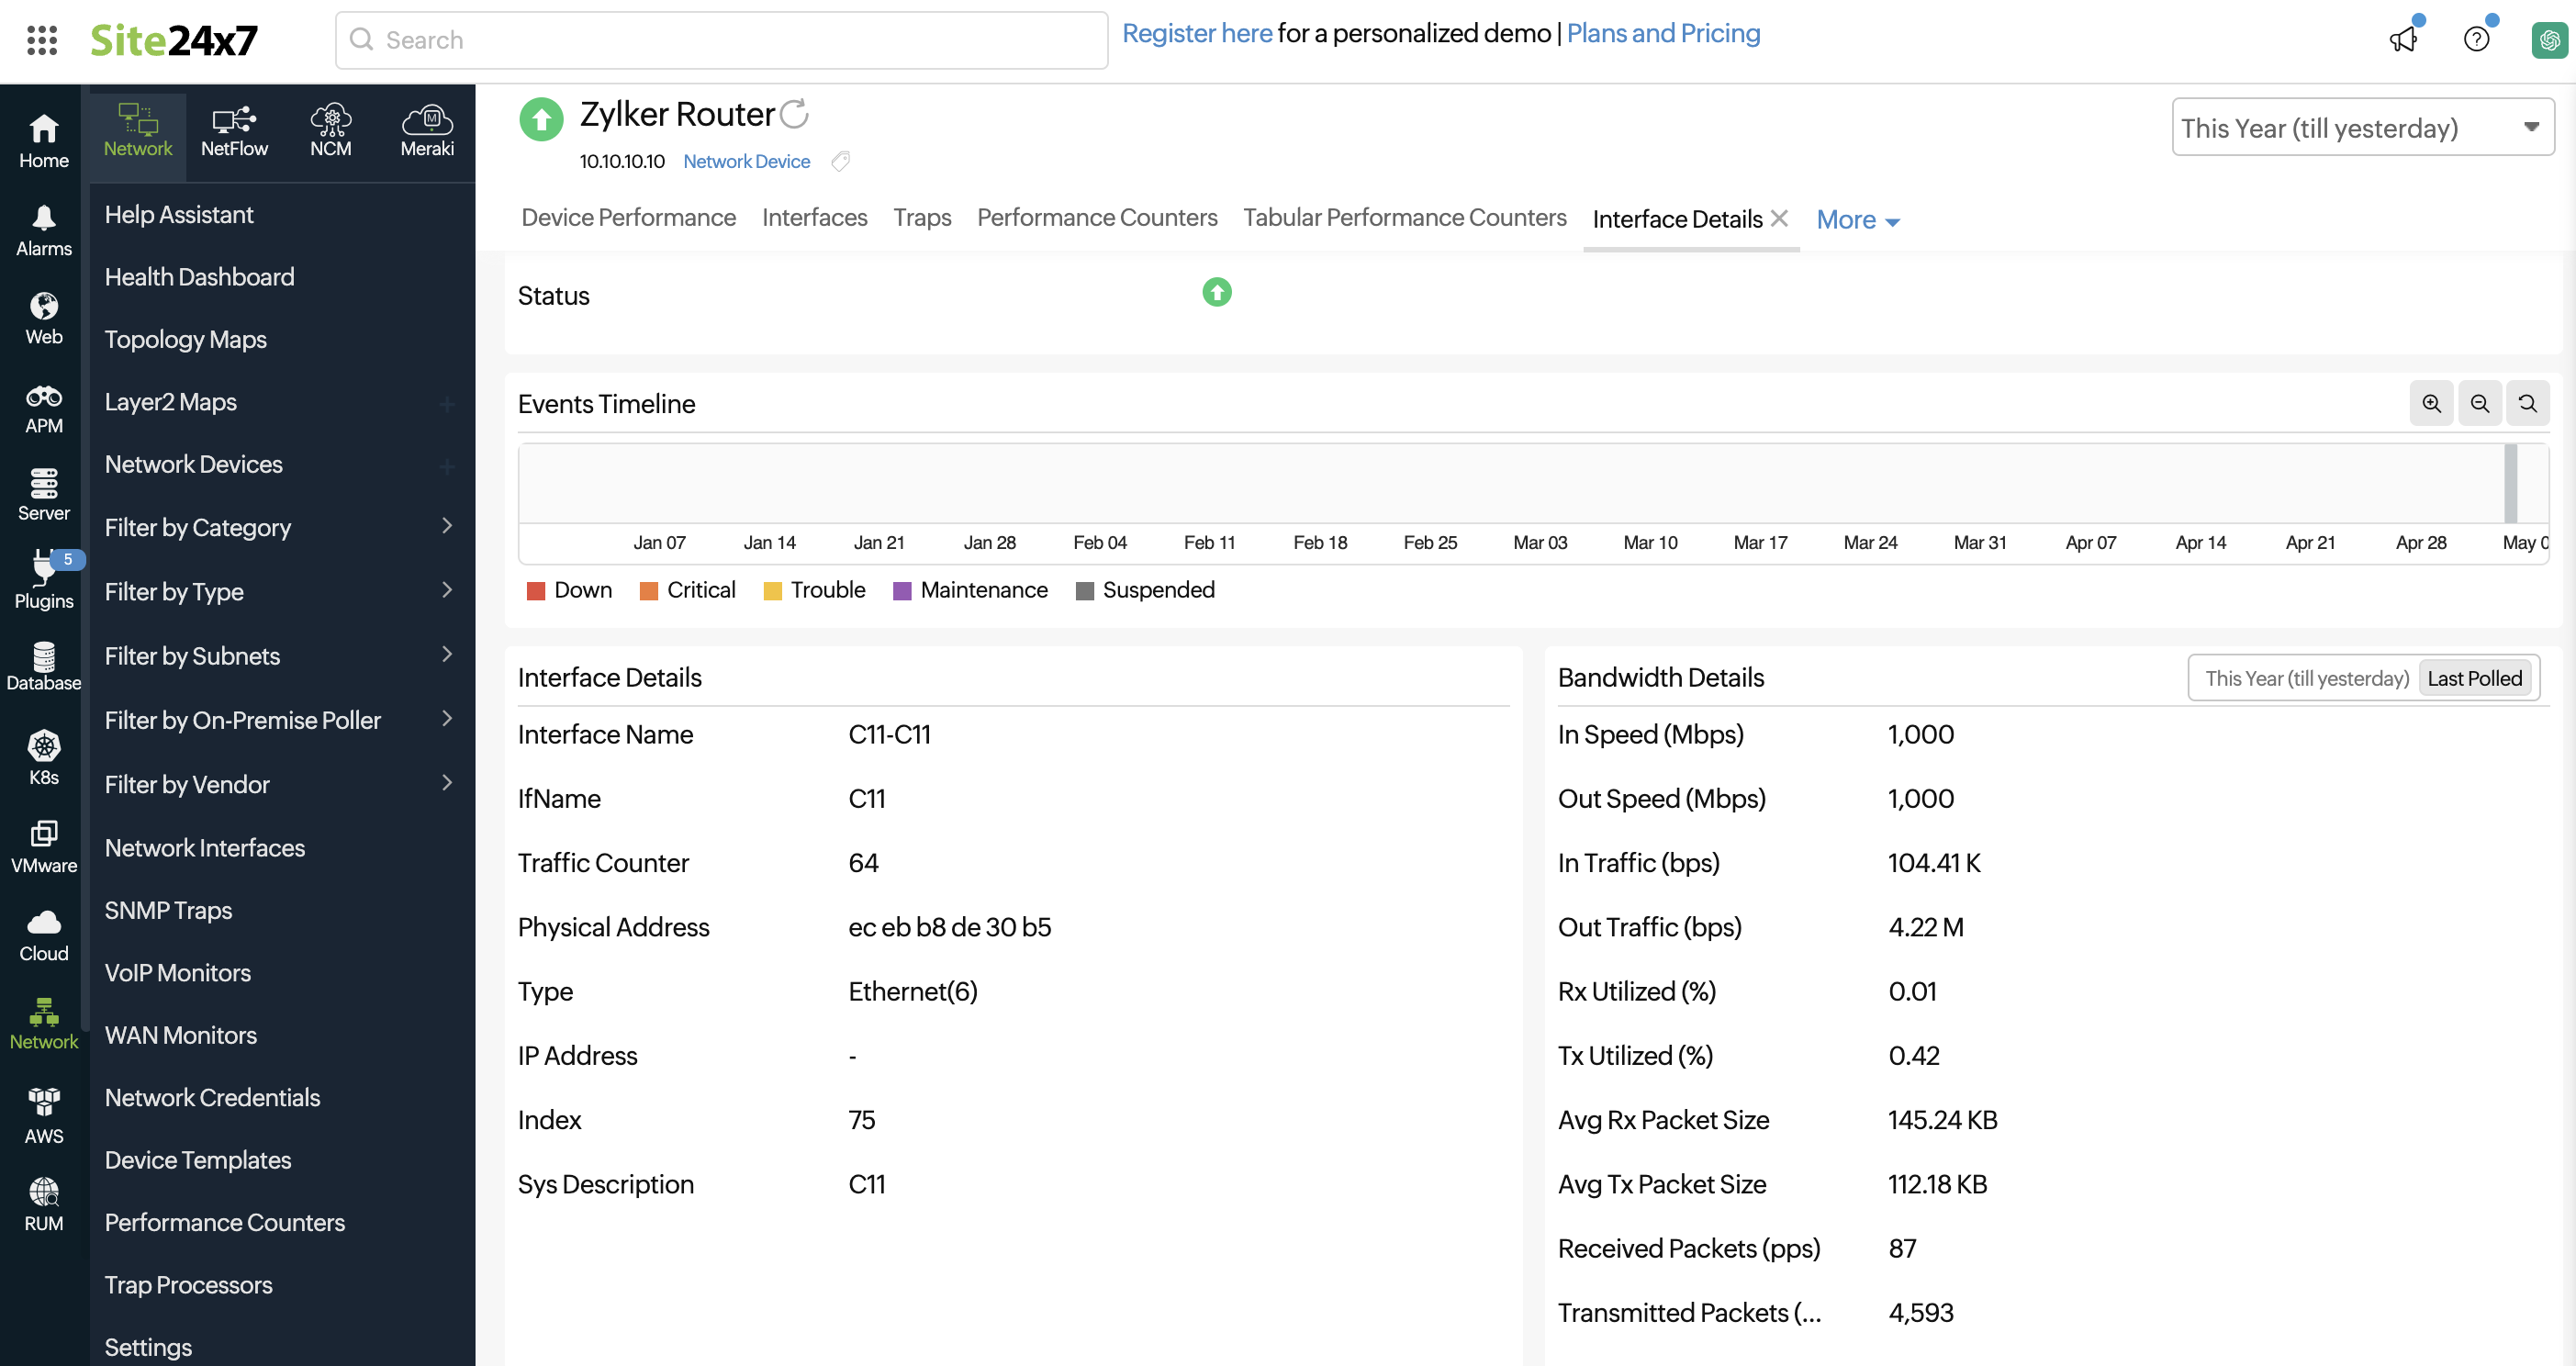
インターフェースをクリックすると、次の詳細が表示されます。
| パラメーター | 説明 |
|---|---|
| Admin State | The admin state of the interface: up or down |
| Operational State | The operational state of the interface: up, trouble, or down |
| Receive Utilization | The amount of received traffic utilized by the interface |
| Transmit Utilization | The amount of transmitted traffic utilized by the interface |
| Utilization | The average of the received and transmitted traffic utilized |
| In Traffic | The amount of traffic received by the interface |
| Out Traffic | The amount of traffic transmitted by the interface |
| Traffic | The total traffic |
| Packets Received | The number of error packets received by the interface |
| Packets Sent | The number of error packets sent by the interface |
| Packets | The total number of packets handled by the interface |
| Rx Volume | The total volume received in bytes |
| Tx Volume | The total volume transmitted in bytes |
| Volume | The total volume in bytes |
| Errors (%) | The percentage of error packets received by the interface |
| Discards (%) | The percentage of packets discarded by the interface (out of the total number of packets) |
| Error and Discard Percentage | The percentages of errors and discards, including the Average, Maximum, and Minimum |
| Error and Discard Count | The counts of errors and discards, including the Average, Maximum, and Minimum |
帯域幅の詳細も他のメトリックとともにキャプチャされます。
| パラメーター | 説明 |
|---|---|
| In Speed (Mbps) | The amount of bandwidth that can be received by the interface; this is a constant value from the SNMP response of that interface |
| Out Speed (Mbps) | The amount of bandwidth transmitted by the interface; this is a constant value from the SNMP response of that interface |
| In Traffic (bps) | The amount of traffic received by the interface |
| Out Traffic (bps) | The amount of traffic transmitted by the interface |
| Rx Utilized (%) | The amount of received traffic utilized by the interface |
| Tx Utilized (%) | The amount of transmitted traffic utilized by the interface |
| Avg Rx Packet Size | The average packet size received for a period of time |
| Avg Tx Packet Size | The average packet size transmitted for a period of time |
| Received Packets (pps) | The number of error packets received by the interface |
| Transmitted Packets (pps) | The number of error packets sent by the interface |
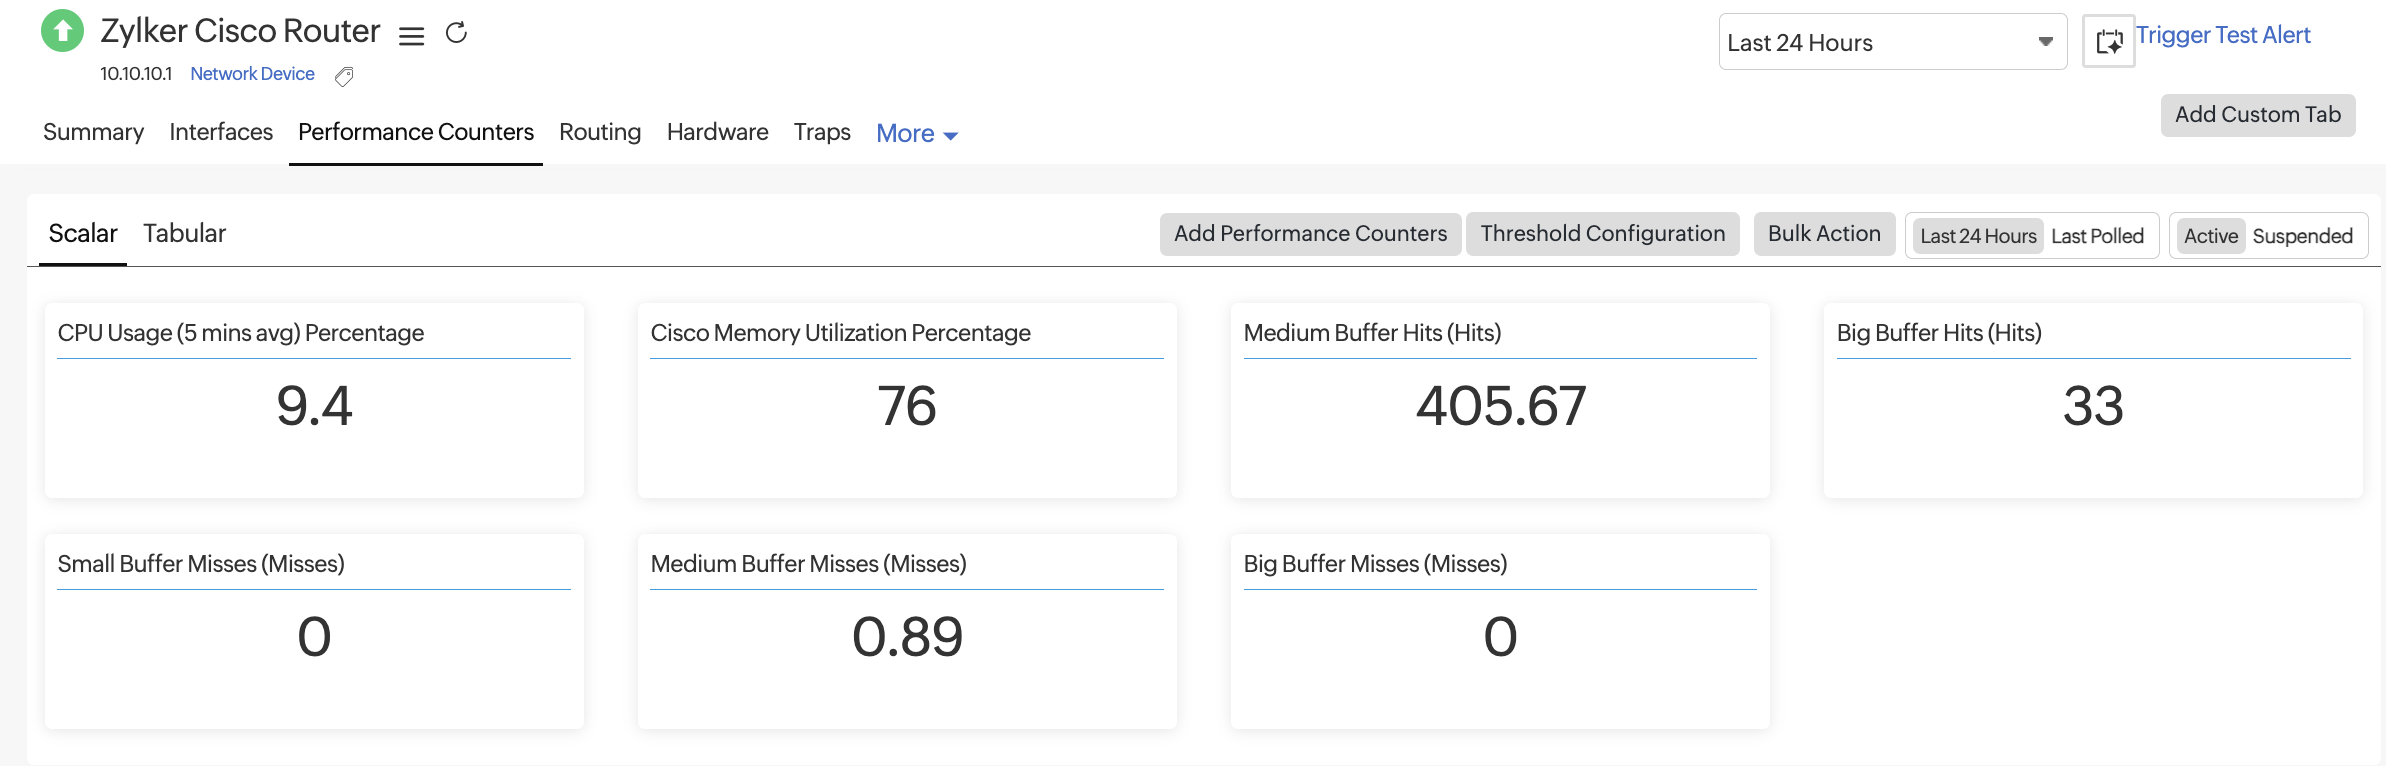
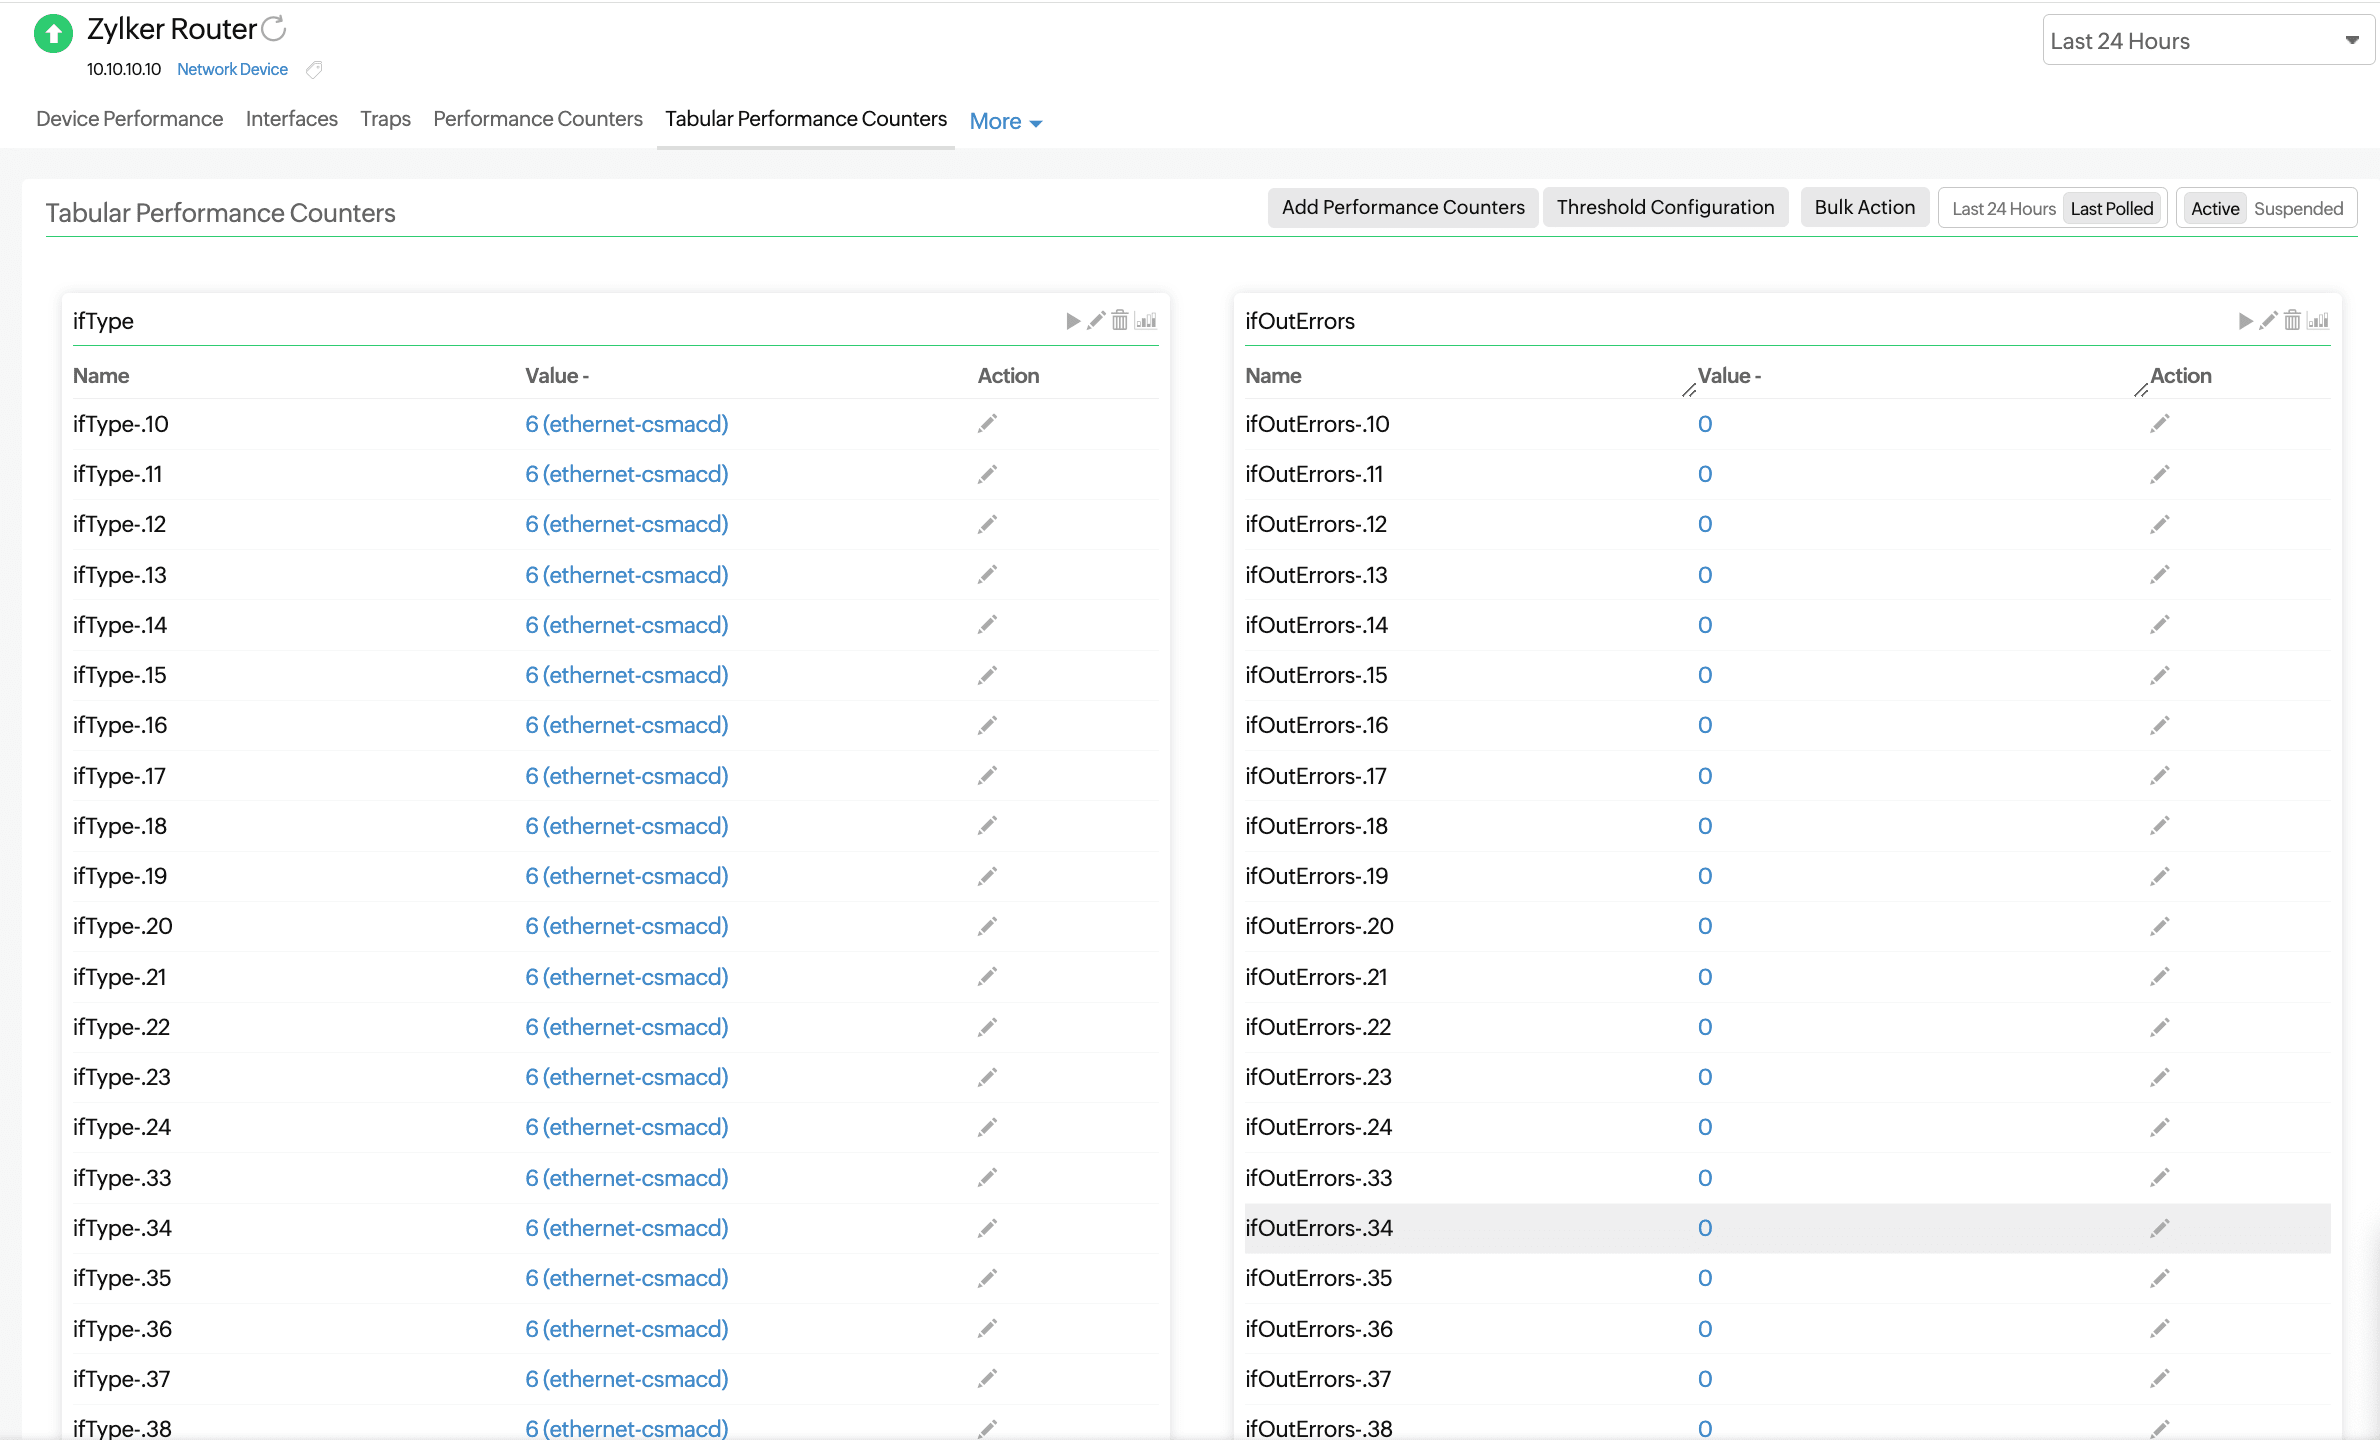
パフォーマンスカウンター
このタブには、デバイスに関連付けられたカスタムパフォーマンスカウンターが一覧表示されます。表の上部にある「スカラー」と「表形式」を切り替えると、それぞれのパフォーマンスカウンターが表示されます。
温度統計、メモリ使用率、CPU使用率など、単一の値を持つメトリックを表示します。
ネットワークデバイスの表形式のSNMPオブジェクト識別子を監視します。これにより、単一のネットワークデバイスにおいて、同じ属性(メモリ、ディスク、インターフェースなど)の複数のインスタンスを監視できます。
ルーティング
ネットワークに設定されているルーターの可用性と応答時間を追跡します。バッファヒット統計やバッファミス統計といった主要なルーターパフォーマンスメトリックを詳細に可視化します。
| セクション | 説明 | 目的 |
|---|---|---|
| BGP Peer Metrics | The metrics related to BGP peers, such as the state, uptime, and flaps | Helps you track the stability and performance of BGP sessions with external or internal peers |
| OSPF Neighbor Metrics | The OSPF neighbor details, like the adjacency state, neighbor ID, and cost | Monitors OSPF neighbor relationships and detects routing issues in the OSPF domain |
| EIGRP Peer Metrics | The list of EIGRP peers and their associated route metrics | Helps you validate EIGRP peering and identify changes in routing path selection |
| Buffer Hit Statistics | The average of the number of buffer hits for a period of time, along with the size of the buffer; there are four types of buffers: huge, large, big, and medium | Indicates how efficiently buffer memory is being used, which affects traffic handling |
| Buffer Miss Statistics | The average of the number of buffer misses for a period of time, along with the size of the buffer; there are four types of misses: big, small, medium, and large | Helps you identify if traffic is being dropped or delayed due to buffer exhaustion or bottlenecks |
ハードウェア
[ハードウェア]タブを使用して、Ciscoデバイスの物理的な正常性を監視します。このセクションには、温度、ファン速度、電源ステータスなどのセンサーレベルのデータが表示されます。センサーの状態、センサー値、ステータスを確認し、必要に応じて各行またはカテゴリのしきい値を設定できます。利用可能なセンサーは、温度センサー、ファンセンサー、電源センサーに分類されています。
各メトリックに表示される利用可能な列の説明は次のとおりです。
| メトリック | 説明 |
| Name | The hardware component being monitored |
| Sensor State | The operational state of the sensor (e.g., Normal, Warning, or Failed) |
| Sensor Value | The real-time temperature reading in degrees Celsius (°C) |
| Status | The overall health of the sensor based on threshold rules |
| Action | This allows you to edit threshold configurations for that specific sensor |
温度センサー
| 名前 | 説明 |
| CPU | The temperature of the device's CPU |
| Exhaust Left | The temperature of the air exiting from the left side of the device |
| Exhaust Right | The temperature of the air exiting from the right side of the device |
| Intake Left | The temperature of the air entering from the left side of the chassis |
| Intake Right | The temperature of the air entering from the right side of the chassis |
| Power Supply | The temperature of the device’s power supply unit (to detect overheating) |
ファンセンサー
| 名前 | 説明 |
| Fan 1 | The first internal fan's operational status |
| Fan 2 | The second internal fan's operational status |
| Fan 3 | The third internal fan's operational status |
| Fan 4 | The fourth internal fan's operational status |
| Fan Tray | The operational status of the entire fan assembly or tray that houses multiple fans |
電力センサー
| 名前 | 説明 |
|---|---|
| C2921/C2951 AC Power Supply | The state of the main AC power supply unit for Cisco 2921 and 2951 devices |
| Redundant Power Supply | The state of the backup power module used for failover in case the main power supply fails |

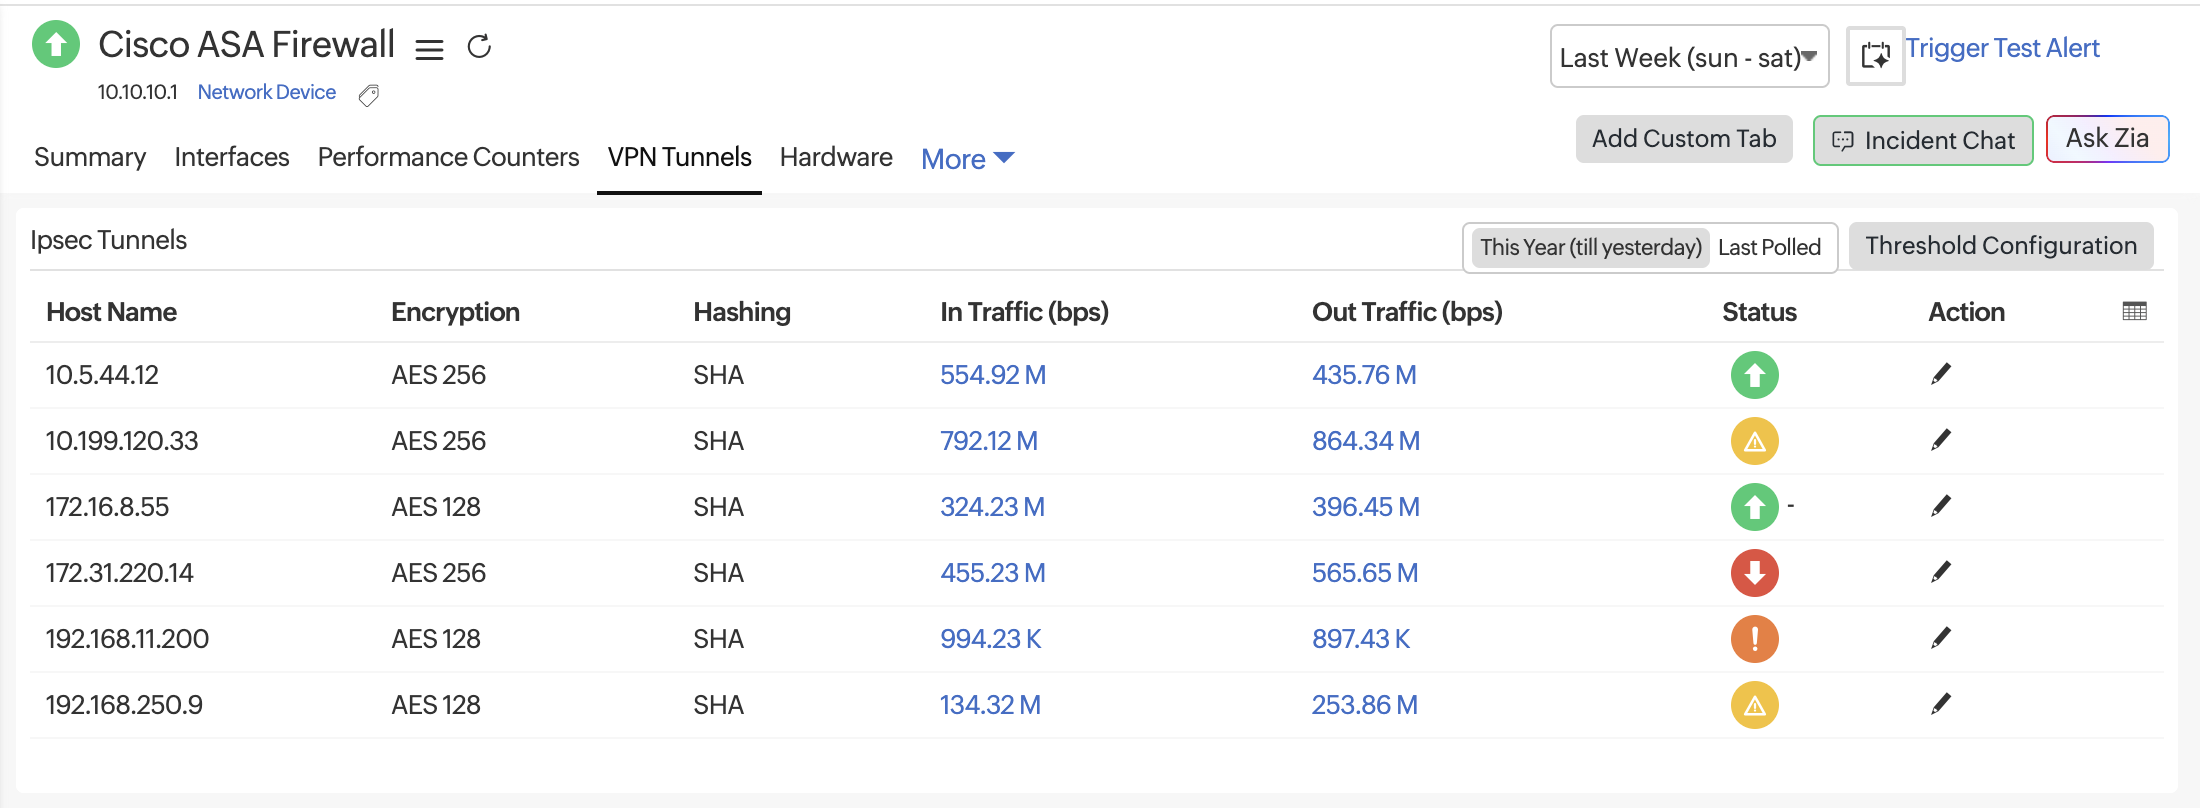
VPNトンネル
[VPNトンネル]タブには、監視対象ファイアウォールで検出されたすべてのIPsecトンネルが表示されます。これらの指標は、トンネルの正常性、暗号化ステータス、サイト間のリアルタイムトラフィックフローを追跡するのに役立ちます。これらの情報を活用して、トンネルの不安定性や帯域幅の飽和をトラブルシューティングできます。
このタブは、FortiGate、Cisco、およびWatchGuardファイアウォールで表示されます。
メトリック
| メトリック | 説明 |
| Host Name | The peer IP address or tunnel endpoint associated with the IPsec connection. |
| Encryption | The encryption algorithm applied for securing VPN data (e.g., AES-128, AES-256, or 3DES). Shows NONE when encryption is not configured. |
| Hashing | The hashing or integrity verification method used (e.g., SHA, SHA-256, or MD5). |
| In Traffic (bps) | The inbound data rate over the VPN tunnel, measured in bits per second. Useful for identifying ingress bandwidth usage and load. |
| Out Traffic (bps) | The outbound data rate over the VPN tunnel, measured in bits per second. Helps identify egress bandwidth consumption and potential traffic asymmetry. |
| Status | Indicates the operational state of the tunnel. A green icon represents an active, healthy tunnel. |
| Action | Options to edit thresholds by clicking the pencil icon. |