ヘルプ Amazon Web Services Amazon RDS
RDS監視 連携
Amazon RDS
AmazonのRelational Database Service(RDS)は、クラウドにSQLデータストアをデプロイおよび拡張できるマネージドWebサービスです。Site24x7とAWSの連携により、アクティブな各リレーショナルデータベースインスタンスで、CPU使用率、CPUクレジット使用率、バーストバランス、読み込み/書き込みIOPS、データベース接続、ネットワークスループットなどのメトリクスを監視できます。すべてのRDSエンジンタイプがサポートされています。
設定
- まだお済みでない場合は、Site24x7のAWSアカウント(IAMユーザーまたはIAMロール)へのアクセスを有効にします。詳細はこちら
- AWSアカウント連携ページで、[RDS]リストの横にあるチェックボックスを選択します。詳細はこちら
RDS監視パフォーマンス分析
パフォーマンス分析はAWSが提供する高度なツールです。これを使用してRDSデータベースインスタンスのパフォーマンスを詳細に把握し、パフォーマンスの問題を診断してデータベース操作を最適化することができます。
Site24x7のRDSパフォーマンス分析監視を使用することで、RDSインスタンスのパフォーマンスをリアルタイムで監視および分析できます。
Site24x7のRDS監視を最大限に活用するには、AWSマネジメントコンソールでパフォーマンス分析を有効にする必要があります。
AWSコンソールでRDSインスタンスのパフォーマンス分析を有効にする方法は以下の通りです。
- AWS管理コンソールを開きます。
- [RDS]に移動し、[データベース]を選択してください。
- パフォーマンス分析を有効にする[インスタンス]を選択します。
- [変更]をクリックします。
- [管理]セクションから、[パフォーマンス分析情報をオンにする]オプションを有効にし、保持期間を設定します。
- 変更内容を確認して、[続行]をクリックします。
- 該当する[スケジュール変更オプション]を選択し、[クラスターの変更]をクリックします。
- When you set the Enable RDS Performance Insights option in the Advanced Configuration section to No, Performance Insights configured for all RDS instances will be suspended for the applicable AWS account, and Site24x7 will disable Performance Insights monitoring.
- When you define the criteria for an RDS instance and set the Enable RDS Performance Insights action to False in the Admin > Configuration Rules section, Performance Insights configured for all RDS instances will be suspended across all integrated AWS accounts in Site24x7.
Site24x7でRDSインスタンスのパフォーマンス分析監視を無効にする方法は以下の通りです。
- 監視対象であるRDSインスタンスの[監視詳細の編集]ページに移動します。
- [パフォーマンス分析情報をオンにする]オプションを[いいえ]に切り替えます。
- [保存]をクリックします。
ポリシーと権限
Site24x7のIAMエンティティに割り当てられているポリシーに、以下の読み込みレベルでのAPIアクションが存在することを確認します。詳細はこちら
- "rds:ListTagsForResource",
- "rds:DescribeDBInstances",
- "rds:DescribeDBLogFiles",
- "rds:DescribeAccountAttributes",
- "rds:DescribeDBClusters",
- "rds:DescribeEvents"
- "rds:DescribeDBClusterParameters",
- "rds:DescribePendingMaintenanceActions",
- "rds:DescribeDBClusterEndpoints"
ポーリング間隔
Site24x7が設定ポーリング間隔(1分から1日)ごとにCloudWatch APIにクエリし、RDSリソースのパフォーマンスメトリックを収集します。詳細はこちら
IT自動化
AWSサービスの自動化を追加できます。Site24x7にログインして、管理 → IT自動化テンプレート (+) → 自動化テンプレートの追加の順にクリックします。自動化を追加したら、それらをスケジュールして実行することも可能です。
Amazon RDS自動化を使用してDBインスタンスをフェールオーバーして起動、停止、再起動を行えます。
サポートしているパフォーマンスメトリクス
Amazon RDSメトリック
| 属性 | 詳細 | 統計 | データタイプ |
|---|---|---|---|
| バイナリーログディスク使用量 | マスターでバイナリーログが占有するディスク領域の量です。MySQLリードレプリカのみ適用可能です。 | 平均 | バイト |
| バッファーキャッシュヒット率 | バッファキャッシュによって処理されたリクエストの割合を測定します。 | 平均 | パーセンテージ |
| バーストバランス | GP2のバーストバケットI/Oクレジットの利用可能な割合です。 | 平均 | パーセンテージ |
| CPU使用率 | CPU使用率です。 | 平均 | パーセンテージ |
| CPUクレジット使用率 | DBインスタンスが使用したクレジット数です。 | 平均 | カウント |
| CPUクレジットバランス | 発生したCPUクレジットの獲得数です。 | 平均 | カウント |
| CPU余剰クレジットバランス | 消費された余剰クレジットの数です。T2 Unlimitedインスタンスにのみ適用可能です。 | 平均 | カウント |
| データベース接続数 | 使用中のデータベース接続数です。 | 平均、合計、最大 | カウント |
| データベース接続数 | active/open接続数です。 | 平均 | カウント |
| CPU余剰クレジット | 獲得CPUクレジットによる支払いがない、消費された余剰クレジットの数です。T2 Unlimitedインスタンスにのみ適用可能です。 | 平均 | カウント |
| ディスクキュー長 | 未処理のI/Oリクエスト(読み取り/書き込みリクエスト)数です。 | 平均 | カウント |
| 空きメモリ | 利用可能なRAMの容量です。 | 平均 | バイト |
| 空きストレージ容量 | 利用可能なストレージ領域の容量です。 | 平均 | バイト |
| 最大使用トランザクションID | 使用された最大のトランザクションIDです。PostgreSQLにのみ適用可能です。 | 平均 | カウント |
| 受信ネットワークスループット | DBインスタンス上の着信(受信)ネットワークトラフィックです。顧客とAmazon RDSの両方のトラフィックが含まれます。 | 平均 | MB/秒 |
| 送信ネットワークスループット | DBインスタンス上の発信(送信)ネットワークトラフィックです。顧客とAmazon RDSの両方のトラフィックが含まれます。 | Average | MB/秒 |
| 最古レプリケーションスロットラグ | 受信したWALデータに関して最も遅延の大きいレプリカの遅延サイズです。 | 平均 | カウント |
| 読み込みIOPS | 1秒あたりのディスク読み込みI/O操作の平均回数です。 | 平均 | カウント/秒 |
| 読み込みレイテンシー | 1回のディスクI/O操作にかかる平均時間です。 | 平均 | 秒 |
| 読み込みスループット | 1秒あたりのディスクからの平均読み込みバイト数です。 | 平均 | バイト/秒 |
| レプリカラグ | ソースDBインスタンスからリードレプリカDBインスタンスまでのラグタイムです。 | 平均 | 秒 |
| スワップ使用量 | 使用されているスワップスペースの量を測定します。 | 平均 | バイト |
| トランザクションログディスク使用量 | トランザクションログで使用されているディスク容量です。PostgreSQLにのみ適用可能です。 | 平均 | MB |
| トランザクション生成ログ | 1秒あたりに生成されるトランザクションログのサイズです。PostgreSQLにのみ適用されます。 | 平均 | カウント |
| 書き込みIOPS | 1秒あたりのディスク書き込みI/O操作の平均回数です。 | 平均 | カウント/秒 |
| 書き込みレイテンシー | 1回のディスクI/O操作にかかる平均時間です。 | 平均 | 秒 |
| 書き込みスループット | 1秒あたりのディスクへの平均書き込みバイト数です。 | 平均 | バイト/秒 |
| EBS IOバランスパーセンテージ | RDSデータベースのバーストバケットで保持しているI/Oクレジットのパーセンテージです。 | 平均 | パーセンテージ |
| EBS バイトバランスパーセンテージ | RDSデータベースのバーストバケットで保持しているスループットクレジットのパーセンテージです。 | 平均 | パーセンテージ |
| 最大使用ストレージパーセンテージ | 割り当てストレージ合計以外に使用されているストレージの最大パーセンテージです。 | 平均 | パーセンテージ |
| メモリ使用率 | RDSインスタンスで使用している合計メモリのパーセンテージです。 | 平均 | パーセンテージ |
Amazon Auroraメトリック
| 属性 | 詳細 | 統計 | データタイプ |
|---|---|---|---|
| アクティブトランザクション | Auroraデータベースインスタンスで実行されている現在のトランザクション数です。 | 合計 | カウント |
| Aurora Binlogレプリカラグ | MySQLを使用してAurora上で実行されているレプリカDBクラスターが、ソースDBクラスターよりも遅れている時間です。 | 平均 | ミリ秒 |
| Aurora レプリカラグ | 更新をレプリケートする際のタイムラグです。 | 平均 | ミリ秒 |
| Aurora 最大レプリカラグ | プライマリインスタンスと各Aurora DBインスタンス間の最大遅延量です。 | 平均 | ミリ秒 |
| Aurora 最小レプリカラグ | プライマリインスタンスと各Aurora DBインスタンス間の最小遅延量です。 | 平均 | ミリ秒 |
| ブロックされたトランザクション | ブロックされたトランザクション数です。 | 合計 | カウント |
| コミットレイテンシー | コミット操作のレイテンシーです。 | 平均 | ミリ秒 |
| コミットスループット | 1秒あたりのコミット操作数です。 | 平均 | カウント/秒 |
| DDLレイテンシー | データ定義言語(DDL)リクエストのレイテンシーです。 | 合計 | ミリ秒 |
| DDLスループット | DDLリクエスト数です。 | 合計 | カウント/秒 |
| デッドロック | データベース内のデッドロック数です。 | 合計 | カウント |
| 削除レイテンシー | DELETEクエリのレイテンシーです。 | 平均 | ミリ秒 |
| 削除スループット | 1秒あたりのDELETEクエリ数です。 | 平均 | カウント/秒 |
| DMLレイテンシー | 挿入、更新、削除のレイテンシーです。 | 平均 | ミリ秒 |
| DMLスループット | 1秒あたりの挿入、更新、削除の平均回数です。 | 平均 | カウント/秒 |
| アップタイム | インスタンス実行時間です。 | 平均 | 秒 |
| 空きローカルストレージ | 一時テーブルおよびログで使用可能なストレージ容量です。 | 平均 | MB |
| 挿入レイテンシー | INSERT クエリのレイテンシーです。 | 平均 | ミリ秒 |
| 挿入スループット | 1秒あたりのINSERTクエリの平均回数です。 | 平均 | カウント/秒 |
| ログイン失敗 | 1秒あたりの失敗したログイン試行回数です | 合計 | カウント |
| ネットワークスループット | 各インスタンスがクライアントとの間で送受信したバイト数です。 | 平均 | カウント/秒 |
| クエリ | 実行されたクエリ数です。 | 平均 | カウント/秒 |
| リザルトセットキャッシュヒット | Resultsetキャッシュによって処理されるリクエスト数です。 | 平均 | パーセンテージ |
| 選択レイテンシー | SELECTクエリのレイテンシーです。 | 平均 | ミリ秒 |
| 選択スループット | SELECTクエリの平均数です。 | 平均 | カウント/秒 |
| 更新レイテンシー | UPDATEクエリのレイテンシーです。 | 平均 | ミリ秒 |
| 更新スループット | UPDATEクエリの平均数です。 | 平均 | カウント/秒 |
| 使用ボリュームバイト | Aurora DBインスタンスによって使用されているストレージの量です。 | 平均 | MB |
| 読み取りボリュームIOP | クラスターボリュームからの課金読み込みI/O操作数です。 | 合計 | カウント |
| 書き込みボリュームIOP | クラスターボリュームへの課金書き込みI/O操作数です。 | 合計 | カウント |
| サーバーレスデータベース容量 | Serverless Auroraデータベースインスタンスの容量です。 | 平均 | カウント |
| 請求バックアップストレージの合計 | 請求対象のバックアップストレージの合計容量です。 | 最大 | GB |
| 使用スナップショットストレージ | スナップショットで消費されているバックアップストレージの合計容量です。 | 最大 | GB |
| バックアップ拡張期間使用ストレージ | バックアップ保存期間内で特定時点への復元機能をサポートするために使用されるバックアップストレージの合計容量です。 | 最大 | GB |
| バックトラック変更レコード作成 | 時間の経過とともに作成されたバックトラック変更レコード数です。 | 平均 | カウント |
| 保存バックトラック変更レコード | バックトラック変更レコードの実際の数です。 | 平均 | カウント |
| 実際のバックトラックウィンドウ | ターゲットバックトラックウィンドウと、実際のバックトラックウィンドウの差異です。 | 平均 | 分 |
| バックトラックウィンドウアラート | 実際のバックトラックウィンドウが、ターゲットバックトラックウィンドウよりも小さかった回数です。 | 平均 | カウント |
| ロールバックセグメント履歴リスト長 | 削除にマークしたレコードにコミットされたトランザクションをレコードするundoログです。このレコードはInnoDB purge操作によりスケジュール処理されます。 | 最大 | 数 |
| 行ロック時間 | InnoDBテーブルの行ロックに要した時間です。 | 平均 | ミリ秒 |
| ライターフル拒否Aurora DML | ライターインスタンスがフルであったことにより、拒否されたデータ操作言語(DML)数です。 | 平均 | 数 |
| Aurora推定共有メモリバイト | Auroraデータベースインスタンスで使用されている共有メモリの推定量です。 | 平均 | バイト |
| Auroraスロー接続ハンドル数 | 接続までに長い時間を要した接続であったスロー接続ハンドル数です。 | 平均 | 数 |
| Auroraスローハンドシェイク数 | 完了までに長い時間を要した最初の接続試行をしたスローハンドシェイク数です。 | 平均 | 数 |
| Auroraボリュームバイト残り合計 | ストレージ内の残りバイト量の合計です。 | 平均 | バイト |
| 接続試行 | Auroraデータベースインスタンスに行われた接続試行回数です。 | 平均 | 数 |
| バイナリーログファイル数 | Auroraデータベースインスタンスで使用されているバイナリーログファイル数です。 | 平均 | 数 |
| ストレージネットワーク受信スループット | ストレージ層で受信したデータのネットワークスループットです。 | 平均 | バイト/秒 |
| ストレージネットワークスループット | ストレージ層のネットワークスループット全体です。 | 平均 | バイト/秒 |
| ストレージネットワーク送信スループット | ストレージ層により送信されたデータのネットワークスループットです。 | 平均 | バイト/秒 |
| バイナリーログサイズの合計 | すべてのバイナリーログファイルで使用されているサイズ合計です。 | 平均 | バイト |
| IOPSの合計 | AuroraデータベースインスタンスのIOPS数の合計です。 | 平均 | 数 |
| 中断したクライアント | Auroraデータベースインスタンスへのクライアント接続が中断された回数です。 | 平均 | 数 |
| ACU使用率 | Auroraキャパシティユニットの使用率です。使用されているCPUとメモリリソース量を表します。 | 平均 | パーセンテージ |
| 一時ストレージIOPS | Auroraデータベースインスタンスで使用されている一時ストレージのIOPS数です。 | 平均 | 数 |
| 一時ストレージスループット | Auroraデータベースインスタンスで使用されている一時ストレージのスループットです。 | 平均 | バイト/秒 |
Amazon Auroraパラレルクエリメトリック
| 属性 | 説明 | 統計 | データタイプ |
|---|---|---|---|
| Aurora Pq試行リクエスト | Auroraパラレルクエリ(PQ)リクエスト実行の試行回数です。 | 平均 | 数 |
| Aurora Pq失敗リクエスト | Aurora PQリクエストの実行に失敗した回数です。 | 平均 | 数 |
| Aurora Pq進行中リクエスト | 処理中または完了待機中のAurora PQリクエスト数です。 | 平均 | 数 |
| Aurora Pq実行済みリクエスト | 実行されたAurora PQリクエストの合計です。 | 平均 | 数 |
| Aurora Pq未選択リクエスト | 複雑なクエリやシステム制約などにより実行が未選択となったAurora PQリクエスト数です。 | 平均 | 数 |
| Aurora Pq未選択リクエスト 最小未満の列 | 設定した最小のしきい値未満の列を含むため、未選択となったAurora PQリクエスト数です。 | 平均 | 数 |
| Aurora Pq未選択リクエスト BIT列 | BITデータタイプを含む列により未選択となったAurora PQリクエスト数です。 | 平均 | 数 |
| Aurora Pq未選択リクエスト GEOMETRY列 | GEOMETRYデータタイプを含む列により未選択となったAurora PQリクエスト数です。 | 平均 | 数 |
| Aurora Pq未選択リクエスト LOB列 | ラージオブジェクト(LOB)列により未選択となったAurora PQリクエスト数です。 | 平均 | 数 |
| Aurora Pq未選択リクエスト 仮想列 | 仮想属性を含む列により未選択となったAurora PQリクエスト数です。 | 平均 | 数 |
| Aurora Pq未選択リクエスト バッファープール外の少ないページ | バッファープール外の少ないページにのみアクセスするため未選択となったAurora PQリクエスト数です。 | 平均 | 数 |
| Aurora Pq未選択リクエスト フルテキストインデックス | フルテキストインデックスの信頼性のため未選択となったAurora PQリクエスト数です。 | 平均 | 数 |
| Aurora Pq未選択リクエスト 高バッファープールパーセンテージ | バッファープールの高パーセンテージのため、未選択となったAurora PQリクエスト数です。 | 平均 | 数 |
| Aurora Pq未選択リクエスト インデックスヒント | インデックスヒントの使用により未選択となったAurora PQリクエスト数です。 | 平均 | 数 |
| Aurora Pq未選択リクエスト Innodbテーブルフォーマット | InnoDBテーブルフォーマット制約により未選択となったAurora PQリクエスト数です。 | 平均 | 数 |
| Aurora Pq未選択リクエスト インスタントDDL | 即時データ定義言語(DDL)操作により未選択となったAurora PQリクエスト数です。 | 平均 | 数 |
| Aurora Pq未選択リクエスト 長いトランザクション | 長いトランザクション実行により未選択となったAurora PQリクエスト数です。 | 平均 | 数 |
| Aurora Pq未選択リクエスト WHERE句なし | WHERE句が存在しないため、未選択となったAurora PQリクエスト数です。 | 平均 | 数 |
| Aurora Pq未選択リクエスト 範囲スキャン | 範囲スキャン制約により未選択となったAurora PQリクエスト数です。 | 平均 | 数 |
| Aurora Pq未選択リクエスト 長い行の長さ | システム定義の制限を行の長さが超過したため、未選択となったAurora PQリクエスト | 平均 | 数 |
| Aurora Pq未選択リクエスト 小さいテーブル | 小さいテーブルを含むため、未選択となったAurora PQリクエスト数です。 | 平均 | 数 |
| Aurora Pq未選択リクエスト 一時テーブル | 一時的なテーブルの使用により、未選択となったAurora PQリクエスト数です。 | 平均 | 数 |
| Aurora Pq未選択リクエスト トランザクション単離 | トランザクション単離レベル制約により、未選択となったAurora PQリクエスト数です。 | 平均 | 数 |
| Aurora Pq未選択リクエスト サポートしていないアクセス | サポートされていないアクセスメソッドにより、未選択となったAurora PQリクエスト数です。 | 平均 | 数 |
| Aurora Pq未選択リクエスト サポートしていないストレージタイプ | サポートされていないストレージタイプにより、未選択となったAurora PQリクエスト数です。 | 平均 | 数 |
| Aurora Pq未選択リクエスト UPDATEとDELETE文 | UPDATEまたはDELETE文の使用により、未選択となったAurora PQリクエスト数です。 | 平均 | 数 |
| Aurora Pqリクエスト スロットルされたAmazon Aurora転送レプリカメトリック | システムリソース制限や構成された制限により、スロットルされたAurora PQリクエスト数です。 | 平均 | 数 |
Amazon Aurora転送レプリカメトリック
| 属性 | 説明 | 統計 | データタイプ |
|---|---|---|---|
| 転送レプリカ DMLレイテンシー | Aurora転送レプリカにおけるINSERT、UPDATE、DELETEといったデータ操作言語(DML)のレイテンシーです。 | 平均 | ミリ秒 |
| 転送レプリカ DMLスループット | Aurora転送レプリカにより処理されたデータ操作言語(DML)のレートです。 | 平均 | ミリ秒 |
| 転送レプリカ オープンセッション | Aurora転送レプリカへのオープンセッション(接続)数です。 | 平均 | 数 |
| 転送レプリカ 読み取り待機レイテンシー | Aurora転送レプリカからの読み取り操作の待機時間です。 | 平均 | ミリ秒 |
| 転送レプリカ 読み取り待機スループット | Aurora転送レプリカからの読み取り操作の待機レートです。 | 平均 | 数/秒 |
| 転送レプリカ SELECTレイテンシー | Aurora転送レプリカで実行されたSELECTクエリのレイテンシーです。 | 平均 | ミリ秒 |
| 転送レプリカ SELECTスループット | Aurora転送レプリカで実行されたSELECTクエリのレートです。 | 平均 | 数/秒 |
| 転送ライターDMLレイテンシー | Aurora転送ライターノードでのデータ操作言語(DML)操作のレイテンシーです。 | 平均 | ミリ秒 |
| 転送ライターDMLスループット | Aurora転送ライターノードで処理されたデータ操作言語(DML)のレートです。 | 平均 | 数/秒 |
| 転送ライターオープンセッション |
転送ライターインスタンスでオープンとなっているアクティブデータベース接続(セッション)数です。 プライマリーインスタンスに書き込み転送を行った転送ライターハンドル数です。書き込みロードのオフロードに役立てられます。 |
平均 | 数 |
RDSクラスター
Site24x7とAmazon RDSクラスターの統合では、次のメトリックがサポートされます。
上記に加えて、次の RDS クラスター メトリックもサポートされています。
| メトリック名 | 説明 | 統計 | 単位 |
|---|---|---|---|
| Aurora Global DB DataTransfer Bytes | Amount of data moved between the primary and secondary AWS Regions. | Sum | Bytes |
| Aurora Global DB Progress Lag | Time taken for updates on the primary to be applied on the secondary. | Maximum | Milliseconds |
| Aurora Global DB Replicated Write IO | Number of write operations replicated from the primary to the secondary cluster. | Sum | Count |
| Aurora Global DB Replication Lag | Delay between a write on the primary cluster and its replication to the secondary cluster. | Maximum | Milliseconds |
| Aurora Global DB RPO Lag | Time gap between the latest transaction on the primary and what is safely replicated. | Maximum | Milliseconds |
| Aurora Memory Health State | Current memory health status reported by the cluster. | Maximum | Gauge |
| Aurora DML Rejected Master Full | Number of DML statements rejected because the master instance reached its limits. | Average | Count |
| Aurora Memory Number of Declined Sql Queries Total | Total number of SQL queries declined due to insufficient memory. | Sum | Count |
| Aurora Memory Number of Killed Connection Total | Total number of connections terminated because of low memory. | Sum | Count |
| Aurora Memory Number of Killed Queries Total | Total number of queries stopped because they could not run with the available memory. | Sum | Count |
| Aurora Milliseconds Spent in OOM Recovery | Time spent recovering from an out of memory state. | Maximum | Milliseconds |
| Aurora Number of Successful OOM Recovery | Count of successful recoveries from out of memory (OOM) conditions. | Average | Count |
| Aurora Number of Triggered OOM Recovery | Count of times the system entered out of memory recovery. | Average | Count |
| Aurora Optimized Reads Cache Hit Ratio | Percentage of reads served from the optimized read cache. | Average | Percentage |
| Write Throughput Ephemeral Storage | Rate at which data is written to ephemeral storage. | Average | Bytes per second |
| Purge Boundary | Current value that marks the purge boundary for stored data. | Average | Count |
| Purge Finished Point | Point up to which data purge has been completed. | Average | Count |
| Read IOPS Ephemeral Storage | Number of read operations on ephemeral storage each second. | Average | Count per second |
| Read Latency Ephemeral Storage | Time taken to complete read operations on ephemeral storage. | Average | Seconds |
| Read Throughput Ephemeral Storage | Rate at which data is read from ephemeral storage. | Average | Bytes per second |
| Transaction Age Maximum | Age of the oldest active transaction. | Maximum | Seconds |
| Truncate Finished Point | Highest point up to which truncation is completed. | Maximum | Count |
| Write IOPS Ephemeral Storage | Number of write operations on ephemeral storage each second. | Average | Count per second |
| Write Latency Ephemeral Storage | Time taken to complete write operations on ephemeral storage. | Average | Seconds |
| Free Ephemeral Storage | Amount of unused ephemeral storage available. | Average | Bytes |
| RDS to Aurora Postgre SQL Replica Lag | Delay between updates on the RDS primary and their replication to Aurora PostgreSQL. | Average | Seconds |
Supported RDS Performance Insights metrics
OS General
| メトリック名 | 説明 | 統計 | 単位 |
|---|---|---|---|
| OS General Num VCPUs | The number of virtual CPUs configured for the DB instance. | Average | Count |
| OS General ACU Utilization | The average Aurora Capacity Units (ACU) utilization for the DB instance. | Average | Percentage |
| OS General Max Configured ACU | The maximum Aurora Capacity Units (ACU) configured for the DB instance. | Average | Percentage |
| OS General Min Configured ACU | The minimum Aurora Capacity Units (ACU) configured for the DB instance. | Average | Percentage |
| OS General Serverless Database Capacity | The capacity utilized by the serverless database instance. | Average | Percentage |
OS CPU Utilization
| メトリック名 | 説明 | 統計 | 単位 |
|---|---|---|---|
| CPU Utilization Guest Time | The amount of CPU time spent running a virtual processor under the hypervisor. | Average | Percentage |
| CPU Utilization Idle Time | The amount of CPU time when the CPU is not actively processing any tasks. | Average | Percentage |
| CPU Utilization IRQ Time | The amount of CPU time spent handling interrupts. | Average | Percentage |
| CPU Utilization Nice Time | The amount of CPU time spent on user processes with lower priority (nice). | Average | Percentage |
| CPU Utilization Steal Time | The amount of CPU time stolen from the instance by the hypervisor for other virtual machines. | Average | Percentage |
| CPU Utilization System Time | The amount of CPU time spent on system (kernel) processes. | Average | Percentage |
| CPU Utilization Total | The total CPU utilization across all CPUs. | Average | Percentage |
| CPU Utilization User Time | The amount of CPU time spent on user-level processes. | Average | Percentage |
| CPU Utilization I/O Wait Time | The amount of CPU time spent waiting for I/O operations to complete. | Average | Percentage |
| CPU Utilization Kernel Time | The percentage of time the CPU spends running the kernel. | Average | Percentage |
OS Disk IO
| メトリック名 | 説明 | 統計 | 単位 |
|---|---|---|---|
| Aurora Storage Bytes Received | Bytes received by Aurora storage from the instance. | Average | Bytes |
| Aurora Storage Bytes Transmitted | Bytes transmitted by Aurora storage to the instance. | Average | Bytes |
| Aurora Storage Disk Queue Depth | The length of aurora storage disk queue. | Average | Count |
| Aurora Storage Read IOPS | The number of read I/O operations seconds on Aurora storage. | Average | Seconds |
| Aurora Storage Read Latency | The latency of read operations on Aurora storage. | Average | Milliseconds |
| Aurora Storage Read Throughput | The throughput of read operations on Aurora storage. | Average | Bytes |
| Aurora Storage Write IOPS | The number of write I/O operations seconds on Aurora storage. | Average | Seconds |
| Aurora Storage Write Latency | The latency of write operations on Aurora storage. | Average | Milliseconds |
| Aurora Storage Write Throughput | The throughput of write operations on Aurora storage. | Average | Bytes |
| RDS Temp Disk I/O Average Queue Length | The average queue length for temporary storage in RDS. | Average | Count |
| RDS Temp Disk I/O Average Request Size | The average request size for temporary storage in RDS. | Average | KB |
| RDS Temp Disk I/O Average Wait Time | The average wait time for I/O operations on temporary storage in RDS. | Average | Milliseconds |
| RDS Temp Disk Read IOPS | The number of read I/O operations seconds on temporary storage in RDS. | Average | Seconds |
| RDS Temp Disk I/O Read KB | Kilobytes read from temporary storage in RDS. | Average | KB |
| RDS Temp Disk I/O Read KBps | Kilobytes read seconds from temporary storage in RDS. | Average | KB |
| RDS Temp Disk I/O Read Requests Merged Seconds | The number of read requests merged seconds in temporary storage in RDS. | Average | Seconds |
| RDS Temp Disk Transactions Seconds | Transactions seconds in temporary storage in RDS. | Average | Seconds |
| RDS Temp Disk Utilization | The percentage of utilization of temporary storage in RDS. | Average | Percentage |
| rdstemp.writeIOsPS | The number of write I/O operations seconds on temporary storage in RDS. | Average | Seconds |
| RDS Temp Disk Write IOPS | Kilobytes written to temporary storage in RDS. | Average | Seconds |
| RDS Temp Disk I/O Write KB | Kilobytes written seconds to temporary storage in RDS. | Average | Seconds |
| RDS Temp Disk I/O Write KBps | The number of write requests merged seconds in temporary storage in RDS. | Average | Seconds |
| Filesystem Disk I/O Average Queue Length | The average queue length for filesystem storage. | Average | Count |
| Filesystem Disk I/O Average Request Size | The average request size for filesystem storage. | Average | KB |
| Filesystem Disk I/O Average Wait Time | The average wait time for I/O operations on filesystem storage. | Average | Milliseconds |
| Filesystem Disk Read IOPS | The number of read I/O operations seconds on filesystem storage. | Average | Seconds |
| Filesystem Disk I/O Read KB | Kilobytes read from filesystem storage. | Average | KB |
| Filesystem Disk I/O Read KBps | Kilobytes read seconds from filesystem storage. | Average | KB |
| Filesystem Disk I/O Read Requests Merged Seconds | The number of read requests merged seconds in filesystem storage. | Average | Seconds |
| Filesystem Disk Transactions Seconds | The transactions seconds in filesystem storage. | Average | Seconds |
| Filesystem Utilization | The percentage of utilization of filesystem storage. | Average | Percentage |
| Filesystem Disk Write IOPS | The number of write I/O operations seconds on filesystem storage. | Average | Seconds |
| Filesystem Disk I/O Write KB | Kilobytes written to filesystem storage. | Average | Seconds |
| Filesystem Disk I/O Write KBps | Kilobytes written seconds to filesystem storage. | Average | Seconds |
| Filesystem Disk I/O Write Requests Merged Seconds | The number of write requests merged seconds in filesystem storage. | Average | Seconds |
| OS Diskio Nvme Avgqueue len (2N1) | The average queue length for NVMe (Non-Volatile Memory Express) device nvme2n1. | Average | Count |
| NVMe Disk I/O Average Request Size (2N1) | The average request size for NVMe device nvme2n1. | Average | KB |
| OS Diskio Nvme Await (2N1) | The average wait time for I/O operations on NVMe device nvme2n1. | Average | Milliseocnds |
| OS Diskio Nvme Readi osps (2N1) | The number of read I/O operations seconds on NVMe device nvme2n1. | Average | Seconds |
| NVMe Disk I/O Read KB (2N1) | Kilobytes read from NVMe device nvme2n1. | Average | KB |
| NVMe Disk I/O Read KBps (2N1) | Kilobytes read seconds from NVMe device nvme2n1. | Average | KB |
| NVMe Disk I/O Read Requests Merged Seconds (2N1) | The number of read requests merged seconds on NVMe device nvme2n1. | Average | Seconds |
| NVMe Disk Transactions Seconds (2N1) | Transactions seconds on NVMe device nvme2n1. | Average | Seconds |
| NVMe Disk Utilization (2N1) | The percentage of utilization of NVMe device nvme2n1. | Average | Percentage |
| NVMe Disk Write IOPS (2N1) | The number of write I/O operations seconds on NVMe device nvme2n1. | Average | Seconds |
| NVMe Disk I/O Write KB (2N1) | Kilobytes written to NVMe device nvme2n1. | Average | Seconds |
| NVMe Disk I/O Write KBps (2N1) | Kilobytes written seconds to NVMe device nvme2n1. | Average | Seconds |
| NVMe Disk I/O Write Requests Merged Seconds (2N1) | The number of write requests merged seconds on NVMe device nvme2n1. | Average | Seconds |
| rdsdev.avgQueueLen | The average queue length for RDS device storage. | Average | Count |
| RDS Device Disk I/O Average Queue Length | The average request size for RDS device storage. | Average | KB |
| RDS Device Disk I/O Average Request Size | The average wait time for I/O operations on RDS device storage. | Average | Milliseocnds |
| RDS Device Disk I/O Average Wait Time | The number of read I/O operations seconds on RDS device storage. | Average | Seconds |
| RDS Device Read IOPS | Kilobytes read from RDS device storage. | Average | KB |
| RDS Device Disk I/O Read KB | Kilobytes read seconds from RDS device storage. | Average | KB |
| RDS Device Disk I/O Read KBps | The number of read requests merged seconds on RDS device storage. | Average | Seconds |
| RDS Device Transactions Seconds | Transactions seconds on RDS device storage. | Average | Seconds |
| RDS Device Disk Utilization | The percentage of utilization of RDS device storage. | Average | Percentage |
| RDS Device Write IOPS | The number of write I/O operations seconds on RDS device storage. | Average | Seconds |
| RDS Device Disk I/O Write KB | Kilobytes written to RDS device storage. | Average | Seconds |
| RDS Device Disk I/O Write KBps | Kilobytes written seconds to RDS device storage. | Average | Seconds |
| RDS Device Disk I/O Write Requests Merged Seconds | The number of write requests merged seconds on RDS device storage. | Average | Seconds |
| OS Diskio Nvme Avgqueue len (1N1) | The average queue length for NVMe device nvme1n1. | Average | Count |
| NVMe Disk I/O Average Request Size (1N1) | The average request size for NVMe device nvme1n1. | Average | KB |
| NVMe 1N1 Disk I/O Average Wait Time (1N1) | The average wait time for I/O operations on NVMe device nvme1n1. | Average | Milliseocnds |
| OS Diskio Nvme Read iosps (1N1) | The number of read I/O operations seconds on NVMe device nvme1n1. | Average | Seconds |
| Os Diskio Nvme Readkb (1N1) | Kilobytes read from NVMe device nvme1n1. | Average | KB |
| NVMe Disk I/O Read KBps (1N1) | Kilobytes read seconds from NVMe device nvme1n1. | Average | KB |
| NVMe Disk I/O Read Requests Merged Seconds (1N1) | The number of read requests merged seconds on NVMe device nvme1n1. | Average | Seconds |
| NVMe Disk Transactions Seconds (1N1) | Transactions seconds on NVMe device nvme1n1. | Average | Seconds |
| NVMe Disk Utilization (1N1) | The percentage of utilization of NVMe device nvme1n1. | Average | Percentage |
| NVMe Disk Write IOPS (1N1) | The number of write I/O operations seconds on NVMe device nvme1n1. | Average | Seconds |
| NVMe Disk I/O Write KB (1N1) | Kilobytes written to NVMe device nvme1n1. | Average | Seconds |
| NVMe Disk I/O Write KBps (1N1) | Kilobytes written seconds to NVMe device nvme1n1. | Average | Seconds |
| NVMe Disk I/O Write Requests Merged Seconds (1N1) | The number of write requests merged seconds on NVMe device nvme1n1. | Average | Seconds |
| Average Queue Length (4N1)) | The average queue length for NVMe device nvme4n1. | Average | Count |
| NVMe Disk I/O Average Request Size (4N1) | The average request size for NVMe device nvme4n1. | Average | KB |
| OS Diskio Nvme Await (4N1) | The average wait time for I/O operations on NVMe device nvme4n1. | Average | Milliseconds |
| NVMe Disk I/O Read IOPS (4N1) | The number of read I/O operations seconds on NVMe device nvme4n1. | Average | Seconds |
| NVMe Disk I/O Read KB (4N1) | Kilobytes read from NVMe device nvme4n1. | Average | KB |
| NVMe Disk I/O Read KBps (4N1) | Kilobytes read seconds from NVMe device nvme4n1. | Average | KB |
| NVMe Disk I/O Read Requests Merged Seconds (4N1) | The number of read requests merged seconds on NVMe device nvme4n1. | Average | Seconds |
| NVMe Disk Transactions Seconds (4N1) | Transactions seconds on NVMe device nvme4n1. | Average | Seconds |
| NVMe Disk Utilization (4N1) | The percentage of utilization of NVMe device nvme4n1. | Average | Percentage |
| NVMe Disk Write IOPS(4N1) | The number of write I/O operations seconds on NVMe device nvme4n1. | Average | Seconds |
| NVMe Disk I/O Write KB (4N1) | Kilobytes written to NVMe device nvme4n1. | Average | Seconds |
| NVMe Disk I/O Write KBps (4N1) | Kilobytes written seconds to NVMe device nvme4n1. | Average | Seconds |
| NVMe Disk I/O Write Requests Merged Seconds (4N1) | The number of write requests merged seconds on NVMe device nvme4n1. | Average | Seconds |
| NVMe Disk I/O Average Queue Length (5N1) | The average queue length for NVMe device nvme5n1. | Average | Count |
| NVMe Disk I/O Average Request Size (5N1) | The average request size for NVMe device nvme5n1. | Average | KB |
| OS Diskio Nvme Await (5N1) | The average wait time for I/O operations on NVMe device nvme5n1. | Average | Milliseconds |
| NVMe Disk I/O Read IOPS (5N1) | The number of read I/O operations seconds on NVMe device nvme5n1. | Average | Seconds |
| NVMe Disk I/O Read KB (5N1) | Kilobytes read from NVMe device nvme5n1. | Average | KB |
| NVMe Disk I/O Read KBps (5N1) | Kilobytes read seconds from NVMe device nvme5n1. | Average | KB |
| NVMe Disk I/O Read Requests Merged Seconds(5N1) | The number of read requests merged seconds on NVMe device nvme5n1. | Average | Seconds |
| NVMe Disk Transactions Seconds(5N1) | Transactions seconds on NVMe device nvme5n1. | Average | Seconds |
| NVMe Disk Utilization(5N1) | The percentage of utilization of NVMe device nvme5n1. | Average | Percentage |
| NVMe Disk Write IOPS (5N1) | The number of write I/O operations seconds on NVMe device nvme5n1. | Average | Seconds |
| NVMe Disk I/O Write KB (5N1) | Kilobytes written to NVMe device nvme5n1. | Average | Seconds |
| NVMe Disk I/O Write KBps (5N1) | Kilobytes written seconds to NVMe device nvme5n1. | Average | Seconds |
| NVMe Disk I/O Write Requests Merged Seconds (5N1) | The number of write requests merged seconds on NVMe device nvme5n1. | Average | Seconds |
OS Filesys
| メトリック名 | 説明 | 統計 | 単位 |
|---|---|---|---|
| Filesystem Maximum Files | The maximum number of files that can be stored in the filesystem. | Average | Count |
| Filesystem Total Space | The total storage capacity of the filesystem. | Average | KB |
| Filesystem Used Space | The amount of storage used in the filesystem. | Average | KB |
| Filesystem Used File Percent | The percentage of file storage used in the filesystem. | Average | Percentage |
| Filesystem Used Files | The number of files currently in use in the filesystem. | Average | Count |
| Filesystem Used Percent | The percentage of total filesystem storage used. | Average | Percentage |
OS Load Average Minute
| メトリック名 | 説明 | 統計 | 単位 |
|---|---|---|---|
| Load Average (15 Minutes) | The system load average over the last 15 minutes. | Average | Count |
| Load Average (5 Minutes) | The system load average over the last five minutes. | Average | Count |
| Load Average (1 Minute) | The system load average over the last one minute. | Average | Count |
OS Memory
| メトリック名 | 説明 | 統計 | 単位 |
|---|---|---|---|
| Active Memory | The amount of active memory in use. | Average | KB |
| Memory Buffers | The memory used by buffers. | Average | KB |
| Cached Memory | The amount of cached memory. | Average | KB |
| Database Cache Memory | The amount of memory used by the database cache. | Average | Bytes |
| Database Resident Set Size | The amount of memory in the database resident set size. | Average | Bytes |
| Database Swap Memory | The amount of memory swapped by the database. | Average | Bytes |
| Dirty Memory | The amount of dirty memory. | Average | KB |
| Free Memory | The amount of free memory available. | Average | KB |
| Free Huge Pages | The number of free huge pages. | Average | Count |
| Reserved Huge Pages | The number of reserved huge pages. | Average | Count |
| Huge Pages Size | The size of huge pages. | Average | KB |
| Huge Pages Surplus | The number of surplus huge pages. | Average | Count |
| Total Huge Pages | The total number of huge pages. | Average | Count |
| Inactive Memory | The amount of inactive memory. | Average | KB |
| Mapped Memory | The amount of mapped memory. | Average | KB |
| Out of Memory Kill Count | The count of out-of-memory kill events. | Average | Count |
| Page Tables Memory | The memory used by page tables. | Average | KB |
| Slab Memory | The amount of memory used by the slab allocator. | Average | KB |
| Total Memory | The total memory available. | Average | KB |
| Writeback Memory | The amount of memory in writeback mode. | Average | KB |
| Memory Commit Limit (KB) | The memory commit limit in kilobytes. | Average | KB |
| Memory Commit Peak (KB) | The peak memory commit in kilobytes. | Average | KB |
| Memory Commit Total (KB) | The total memory commit in kilobytes. | Average | KB |
| Kernel Non-Paged Memory (KB) | The non-paged kernel memory in kilobytes. | Average | KB |
| Kernel Paged Memory (KB) | The paged kernel memory in kilobytes. | Average | KB |
| Kernel Total Memory (KB) | The total kernel memory in kilobytes. | Average | KB |
| Memory Page Size | The memory page size. | Average | Bytes |
| Physical Available Memory (KB) | The available physical memory in kilobytes. | Average | KB |
| Physical Total Memory (KB) | The total physical memory in kilobytes. | Average | KB |
| SQL Server Total Memory (KB) | The total memory used by SQL Server in kilobytes. | Average | KB |
| System Cache Memory (KB) | The system cache memory in kilobytes. | Average | KB |
OS Network
| メトリック名 | 説明 | 統計 | 単位 |
|---|---|---|---|
| Network Receive | The network receive data in packets per second. | Average | Bytes |
| Network Transmit | The network transmit data in packets per second. | Average | Bytes |
| Network Read Bytes Per Second | The network read bytes per second. | Average | Bytes |
| Network Write Bytes Per Second | The network write bytes per second. | Average | Bytes |
OS Swap
| メトリック名 | 説明 | 統計 | 単位 |
|---|---|---|---|
| Cached Swap | The amount of swap space that is cached. | Average | KB |
| Free Swap | The amount of free swap space. | Average | KB |
| Swap In | The number of swap-in operations per second. | Average | KB |
| Swap Out | The number of swap-out operations per second. | Average | KB |
| Total Swap | The total amount of swap space. | Average | KB |
OS Tasks
| メトリック名 | 説明 | 統計 | 単位 |
|---|---|---|---|
| Blocked Tasks | The number of tasks that are blocked. | Average | Count |
| Running Tasks | The number of tasks currently running. | Average | Count |
| Sleeping Tasks | The number of tasks that are sleeping. | Average | Count |
| Stopped Tasks | The number of tasks that are stopped. | Average | Count |
| Total Tasks | The total number of tasks. | Average | Count |
| Zombie Tasks | The number of zombie tasks. | Average | Count |
OS DB SQL Tokenized
| メトリック名 | 説明 | 統計 | 単位 |
|---|---|---|---|
| Calls Per Second | The number of SQL calls executed per second. | Average | Count per second |
| Rows Per Second | The number of rows processed per second. | Average | Count per second |
| Total Time Per Second | The total time spent per second in executing SQL calls. | Average | Count per second |
| Shared Blocks Hit Per Second | The number of shared blocks hit per second. | Average | Count per second |
| Shared Blocks Read Per Second | The number of shared blocks read per second. | Average | Count per second |
| Shared Blocks Dirtied Per Second | The number of shared blocks dirtied per second. | Average | Count per second |
| Shared Blocks Written Per Second | The number of shared blocks written per second. | Average | Count per second |
| Local Blocks Hit Per Second | The number of local blocks hit per second. | Average | Count per second |
| Local Blocks Read Per Second | The number of local blocks read per second. | Average | Count per second |
| Local Blocks Dirtied Per Second | The number of local blocks dirtied per second. | Average | Count per second |
| Local Blocks Written Per Second | The number of local blocks written per second. | Average | Count per second |
| Local Block Read Time Per Second | The time spent reading local blocks per second. | Average | Read per second |
| Temporary Blocks Written Per Second | The number of temporary blocks written per second. | Average | Count per second |
| Temporary Blocks Read Per Second | The number of temporary blocks read per second. | Average | Count per second |
| Oracle Cache Blocks Hit Per Second | The number of Oracle cache blocks hit per second. | Average | Count per second |
| Oracle Cache Block Read Time Per Second | The time spent reading Oracle cache blocks per second. | Average | Count per second |
| Storage Blocks Read Per Second | The time number of storage blocks read per second. | Average | Count per second |
| Storage Block Read Time Per Second | The time spent reading storage blocks per second. | Average | Count per second |
| Block Read Time Per Second | The time spent reading blocks per second. | Average | Count per second |
| Block Write Time Per Second | The time spent writing blocks per second. | Average | Count per second |
| Rows Per Call | The number of rows processed per call. | Average | Count |
| Average Latency Per Call | The average latency per SQL call. | Average | Millisecond |
| Shared Blocks Hit Per Call | The number of shared blocks hit per SQL call. | Average | Count |
| Shared Blocks Read Per Call | The number of shared blocks read per SQL call. | Average | Count |
| Shared Blocks Written Per Call | The number of shared blocks written per SQL call. | Average | Count |
| Shared Blocks Dirtied Per Call | The number of shared blocks dirtied per SQL call. | Average | Count |
| Local Blocks Hit Per Call | The number of local blocks hit per SQL call. | Average | Count |
| Local Blocks Read Per Call | The number of local blocks read per SQL call. | Average | Count |
| Local Blocks Dirtied Per Call | The number of local blocks dirtied per SQL call. | Average | Count |
| Local Blocks Written Per Call | The number of local blocks written per SQL call. | Average | Count |
| Local Block Read Time Per Call | Time spent reading local blocks per SQL call. | Average | Count |
| Temporary Blocks Written Per Call | The number of temporary blocks written per SQL call. | Average | Count |
| Temporary Blocks Read Per Call | The number of temporary blocks read per SQL call. | Average | Count |
| Oracle Cache Blocks Hit Per Call | The number of Oracle cache blocks hit per SQL call. | Average | Count |
| Oracle Cache Block Read Time Per Call | Time spent reading Oracle cache blocks per SQL call. | Average | Count |
| Storage Blocks Read Per Call | The number of storage blocks read per SQL call. | Average | Count |
| Storage Block Read Time Per Call | Time spent reading storage blocks per SQL call. | Average | Count |
| Block Read Time Per Call | Time spent reading blocks per SQL call. | Average | Count |
| Block Write Time Per Call | Time spent writing blocks per SQL call. | Average | Count |
| Count Star Per Second | The count of start * queries per second. | Average | Count per second |
| Sum of Timer Wait Per Second | The sum of wait time per second for queries. | Average | Count per second |
| Sum of Select Full Join Per Second | The sum of full join operations per second. | Average | Count per second |
| Sum of Select Range Check Per Second | The sum of range checks per second. | Average | Count per second |
| Sum of Select Scan Per Second | The sum of select scan operations per second. | Average | Count per second |
| Sum of Sort Merge Passes Per Second | The sum of sort merge passes per second. | Average | Count per second |
| Sum of Sort Scan Per Second | The sum of sort scans per second. | Average | Count per second |
| Sum of Sort Range Per Second | The sum of sort range operations per second. | Average | Count per second |
| Sum of Sort Rows Per Second | The sum of rows sorted per second. | Average | Count per second |
| Sum of Rows Affected Per Second | The sum of rows affected per second. | Average | Count per second |
| Sum of Rows Examined Per Second | The sum of rows examined per second. | Average | Count per second |
| Sum of Rows Sent Per Second | The sum of rows sent per second. | Average | Count per second |
| Sum of Created Temporary Disk Tables Per Second | The sum of temporary disk tables created per second. | Average | Count per second |
| Sum of Created Temporary Tables Per Second | The sum of temporary tables created per second. | Average | Count per second |
| Sum of Lock Time Per Second | The sum of lock time per second. | Average | Count per second |
| Sum of Timer Wait Per Call | The sum of wait time per SQL call. | Average | Millisecond |
| Sum of Select Full Join Per Call | The sum of full join operations per SQL call. | Average | Count |
| Sum of Select Range Check Per Call | The sum of range checks per SQL call. | Average | Count |
| Sum of Select Scan Per Call | The sum of select scan operations per SQL call. | Average | Count |
| Sum of Sort Merge Passes Per Call | The sum of sort merge passes per SQL call. | Average | Count |
| Sum of Sort Scan Per Call | The sum of sort scans per SQL call. | Average | Count |
| Sum of Sort Range Per Call | The sum of sort range operations per SQL call. | Average | Count |
| Sum of Sort Rows Per Call | The sum of rows sorted per SQL call. | Average | Count |
| Sum of Rows Affected Per Call | The sum of rows affected per SQL call. | Average | Count |
| Sum of Rows Examined Per Call | The sum of rows examined per SQL call. | Average | Count |
| Sum of Rows Sent Per Call | The sum of rows sent per SQL call. | Average | Count |
| Sum of Created Temporary Disk Tables Per Call | The sum of temporary disk tables created per SQL call. | Average | Count |
| Sum of Created Temporary Tables Per Call | The sum of temporary tables created per SQL call. | Average | Count |
| Sum of Lock Time Per Call | The sum of lock time per SQL call. | Average | Count |
| Execution Count Per Second | The number of executions per second. | Average | Count per second |
| Total Elapsed Time Per Second | The total elapsed time per second for SQL executions. | Average | Count per second |
| Total Rows Per Second_sec | The total number of rows processed per second. | Average | Count per second |
| Total Logical Reads Per Second | The total logical reads per second. | Average | Count per second |
| Total Logical Writes Per Second | The total logical writes per second. | Average | Count per second |
| Total Physical Reads Per Second | The total physical reads per second. | Average | Count per second |
| Total Worker Time Per Second | The total worker time per second for SQL executions. | Average | Count per second |
| Total Elapsed Time Per Call | The total elapsed time per SQL call. | Average | Count |
| Total Rows Per Call | The total number of rows processed per SQL call. | Average | Count |
| Total Logical Reads Per Call | The total logical reads per SQL call. | Average | Count |
| Total Logical Writes Per Call | The total logical writes per SQL call. | Average | Count |
| Total Physical Reads Per Call | The total physical reads per SQL call. | Average | Count |
| Total Worker Time Per Call | The total worker time per SQL call. | Average | Count |
| Execution Plan Count | The number of execution plans generated. | Average | Count |
| Executions Per Second | The number of SQL executions per second. | Average | Count per second |
| Elapsed Time Per Second | The elapsed time per second for SQL executions. | Average | Elapsed time per second |
| Rows Processed Per Second | The number of rows processed per second in SQL executions. | Average | Count per second |
| Buffer Gets Per Second | The number of buffer gets per second during SQL executions. | Average | Count per second |
| Physical Read Requests Per Second | The number of physical read requests per second during SQL executions. | Average | Count per second |
| Physical Write Requests Per Second | The number of physical write requests per second during SQL executions. | Average | Count per second |
| Total Sharable Memory Per Second | The total shareable memory used per second during SQL executions. | Average | Count per second |
| CPU Time Per Second | The total CPU time used per second during SQL executions. | Average | Count per second |
| Elapsed Time Per Execution | The elapsed time per SQL execution. | Average | Count |
| Rows Processed Per Execution | The number of rows processed per SQL execution. | Average | Count |
| Buffer Gets Per Execution | The number of buffer gets per SQL execution. | Average | Count |
| Physical Read Requests Per Execution | The number of physical read requests per SQL execution. | Average | Count |
| Physical Write Requests Per Execution | The number of physical write requests per SQL execution. | Average | Count |
| Total Sharable Memory Per Execution | The total shareable memory used per SQL execution. | Average | Count |
| CPU Time Per Execution | The total CPU time used per SQL execution. | Average | Count |
DB Cache
| メトリック名 | 説明 | 統計 | 単位 |
|---|---|---|---|
| Blocks Hit | The number of blocks hit in the cache. | Average | Blocks per second |
| Buffers Allocated | The number of buffers allocated in the cache. | Average | Blocks per second |
| InnoDB Buffer Pool Reads | The number of reads from the InnoDB buffer pool. | Average | Pages per second |
| InnoDB Buffer Pool Read Requests | The number of read requests from the InnoDB buffer pool. | Average | Pages per second |
| InnoDB Buffer Pool Pages Data | The number of data pages in the InnoDB buffer pool. | Average | Count |
| InnoDB Buffer Pool Pages Total | The total number of pages in the InnoDB buffer pool. | Average | Count |
| Opened Tables | The number of tables opened in the cache. | Average | Count |
| Opened Table Definitions | The number of table definitions opened in the cache. | Average | Count |
| InnoDB Buffer Pool Hit Rate | The number of hits in the InnoDB buffer pool. | Average | Pages per second |
| InnoDB Buffer Pool Hits | The hit rate percentage of the InnoDB buffer pool. | Average | Percentage |
| InnoDB Buffer Pool Usage | The usage percentage of the InnoDB buffer pool. | Average | Percentage |
| Query Cache Hits | The number of query cache hits. | Average | Count |
| Query Cache Hit Rate | The hit rate percentage of the query cache. | Average | Percentage |
| Physical Read Bytes | The number of physical bytes read. | Average | Bytes |
| Database Block Gets | The number of database block gets. | Average | Count |
| Database Writer Checkpoints | The number of database writer (DBWR) checkpoints. | Average | Count |
| Physical Reads | The number of physical reads. | Average | Count |
| Consistent Gets From Cache | The number of consistent gets from the cache. | Average | Count |
| Database Block Gets From Cache | The number of database block gets from the cache. | Average | Count |
| Consistent Gets | The number of consistent gets. | Average | Count |
DB Checkpoint
| メトリック名 | 説明 | 統計 | 単位 |
|---|---|---|---|
| Buffers Checkpoint | The number of buffers written to disk during a checkpoint. | Average | Blocks per second |
| Checkpoint Sync Time | The time taken to synchronize during a checkpoint. | Average | Milliseconds per checkpoint |
| Checkpoint Write Time | The time taken to write data during a checkpoint. | Average | Milliseconds per checkpoint |
| Requested Checkpoints | The number of requested checkpoints. | Average | Checkpoints per minute |
| Timed Checkpoints | The number of timed checkpoints. | Average | Checkpoints per minute |
| Max Written Clean | The number of buffers written by the clean writer during a checkpoint. | Average | Bgwriter clean stops per minute |
| Checkpoint Sync Latency | The latency of synchronization during a checkpoint. | Average | Milliseconds per checkpoint |
| Checkpoint Write Latency | The latency of writing during a checkpoint. | Average | Milliseconds per checkpoint |
DB Concurrency
| メトリック名 | 説明 | 統計 | 単位 |
|---|---|---|---|
| Deadlocks | The number of deadlocks detected. | Average | Deadlocks per minute |
DB IO
| メトリック名 | 説明 | 統計 | 単位 |
|---|---|---|---|
| Block Read Time | Time spent reading blocks from the database. | Average | Milliseconds |
| Blocks Read | Number of blocks read from the database. | Average | Blocks per second |
| Buffers Backend | Number of buffers allocated by the backend. | Average | Blocks per second |
| Buffers Backend Fsync | Number of fsync operations by the backend. | Average | Blocks per second |
| Storage Blocks Read | Number of buffers cleaned by the background writer. | Average | Blocks per second |
| Storage Block Read Time | Number of storage blocks read. | Average | Blocks per second |
| Oracle Cache Blocks Hit | Number of blocks hit in the Oracle cache. | Average | Blocks per second |
| Oracle Cache Block Read Time | Time spent reading blocks from Oracle cache. | Average | Milliseconds |
| Local Blocks Read | Number of local blocks read. | Average | Blocks per second |
| Local Block Read Time | Time spent reading local blocks. | Average | Milliseconds |
| InnoDB Pages Written | Number of InnoDB pages written to disk. | Average | Pages per second |
| InnoDB Data Writes | Number of data writes in InnoDB. | Average | Operations per second |
| InnoDB Log Writes | Number of log writes in InnoDB. | Average | Operations per second |
| InnoDB Log Write Requests | Number of log write requests in InnoDB. | Average | Operations per second |
| InnoDB Double Writes | Number of double write operations in InnoDB. | Average | Operations per second |
| InnoDB Datafile Writes to Disk | Number of datafile write operations to disk in InnoDB. | Average | Operations per second |
DB SQL
| メトリック名 | 説明 | 統計 | 単位 |
|---|---|---|---|
| Tuples Deleted | Number of tuples (rows) deleted. | Average | Tuples per second |
| Tuples Fetched | Number of tuples (rows) fetched. | Average | Tuples per second |
| Tuples Inserted | Number of tuples (rows) inserted. | Average | Tuples per second |
| Tuples Returned | Number of tuples (rows) returned. | Average | Tuples per second |
| Tuples Updated | Number of tuples (rows) updated. | Average | Tuples per second |
| Queries Started | Number of queries started. | Average | Queries per second |
| Queries Finished | Number of queries finished. | Average | Queries per second |
| Total Query Time | Total time spent executing queries. | Average | Milliseconds |
| Logical Reads | Number of logical reads from the database. | Average | Blocks per second |
| COM Analyze | Number of analyze commands executed. | Average | Queries per second |
| COM Optimize | Number of optimize commands executed. | Average | Queries per second |
| InnoDB Rows Inserted | Number of select queries executed. | Average | Queries per second |
| InnoDB Rows Deleted | Number of rows inserted in InnoDB. | Average | Rows per second |
| db.sql.Innodb_rows_deleted | Number of rows deleted in InnoDB. | Average | Rows per second |
| InnoDB Rows Updated | Number of rows updated in InnoDB. | Average | Rows per second |
| db.sql.Innodb_rows_read | Number of rows read in InnoDB. | Average | Rows per second |
| InnoDB Rows Read | Number of questions (queries) sent to the server. | Average | Queries per second |
| Queries | Number of queries executed. | Average | Queries per second |
| Select Full Join | Number of full joins in select queries. | Average | Queries per second |
| Select Full Range Join | Number of full range joins in select queries. | Average | Queries per second |
| Select Range | Number of range select queries. | Average | Queries per second |
| Select Range Check | Number of range check queries in select. | Average | Queries per second |
| Select Scan | Number of table scans in select queries. | Average | Queries per second |
| Slow Queries | Number of slow queries executed. | Average | Queries per second |
| Sort Merge Passes | Number of merge passes in sorting. | Average | Queries per second |
| Sort Range | Number of range sorts. | Average | Queries per second |
| Sort Rows | Number of rows sorted. | Average | Queries per second |
| Sort Scan | Number of scan sorts. | Average | Queries per second |
| Total Query Time | Total time spent on queries. | Average | Milliseconds |
| InnoDB Rows Changed | Number of rows changed in InnoDB. | Average | Rows per second |
| Parse Count Total | Total number of parses executed. | Average | Count |
| Parse Count Hard | Number of hard parses executed. | Average | Count |
| Table Scan Rows Gotten | Number of rows obtained from table scans. | Average | Count |
| Sorts in Memory | Number of sorts performed in memory. | Average | Count |
| Sorts on Disk | Number of sorts performed on disk. | Average | Count |
| Sorts Rows | Number of rows sorted. | Average | Count |
DB Temp
| メトリック名 | 説明 | 統計 | 単位 |
|---|---|---|---|
| Temporary Bytes | Total bytes used by temporary files. | Average | Bytes |
| Temporary Files | Number of temporary files created. | Average | Files per minute |
| Created Temporary Disk Tables | Number of temporary disk tables created. | Average | Tables per second |
| Created Temporary Tables | Number of temporary tables created. | Average | Tables per second |
| Temporary Disk Tables Percent | Percentage of temporary tables created on disk. | Average | Percentage |
DB Transactions
| メトリック名 | 説明 | 統計 | 単位 |
|---|---|---|---|
| Blocked Transactions | Number of transactions currently blocked. | Average | Count |
| Maximum Used Transaction IDs | Maximum used transaction IDs. | Average | Count |
| Transaction Commits | Total number of transaction commits. | Average | Commits per second |
| dTransaction Rollbacks | Total number of transaction rollbacks. | Average | Rollbacks per second |
| Duration of Commits | Duration of transaction commits. | Average | Milliseconds |
| Commit Latency | Latency of transaction commits. | Average | Milliseconds per Transaction |
| Active Transactions | Number of currently active transactions. | Average | Count |
| Transaction Rollback Segment History Length | Length of the transaction rollback segment history. | Average | Count |
DB User
| メトリック名 | 説明 | 統計 | 単位 |
|---|---|---|---|
| Number of Backends | Number of active backends for the user. | Average | Count |
| Total Authentication Attempts | Total number of authentication attempts by the user. | Average | Count |
| Maximum Connections | Maximum number of connections allowed for the user. | Average | Count |
| CPU Used by This Session | CPU usage by the current user session. | Average | Count |
| SQL Net Roundtrips to/from Client | Number of SQL*Net round trips to/from the client. | Average | Count |
| Bytes Received via SQL Net from Client | Bytes received from the client via SQL*Net. | Average | Bytes |
| User Commits | Number of commits made by the user. | Average | Count |
| Cumulative Logons | Total cumulative logons by the user. | Average | Count |
| User Calls | Total number of calls made by the user. | Average | Count |
| Bytes Sent via SQL Net to Client | Bytes sent to the client via SQL*Net. | Average | Bytes |
| User Rollbacks | Number of rollbacks made by the user. | Average | Count |
DB Wal
| メトリック名 | 説明 | 統計 | 単位 |
|---|---|---|---|
| WAL Archived Count | Total number of Write-Ahead Logs archived. | Average | Files per minute |
| WAL Archive Failed Count | Total number of failed Write-Ahead Log archive attempts. | Average | Files per minute |
DB State
| メトリック名 | 説明 | 統計 | 単位 |
|---|---|---|---|
| Active Count | Number of active database connections. | Average | Count |
| Idle Count | Number of idle database connections. | Average | Count |
| Idle in Transaction Count | Number of idle connections in a transaction. | Average | Count |
| Idle in Transaction Aborted Counton_aborted_count | Number of idle connections in an aborted transaction. | Average | Count |
| Idle in Transaction Max Time | Maximum time a connection has been idle in a transaction. | Average | Count |
DB Locks
| メトリック名 | 説明 | 統計 | 単位 |
|---|---|---|---|
| InnoDB Row Lock Time | Time spent waiting for InnoDB row locks. | Average | Milliseconds |
| InnoDB Row Lock Waits | Number of waits for InnoDB row locks. | Average | Count |
| InnoDB Deadlocks | Number of InnoDB deadlocks. | Average | Deadlocks per minute |
| InnoDB Lock Timeouts | Number of InnoDB lock timeouts. | Average | Count |
| Table Locks Immediate | Number of immediate table locks. | Average | Requests per Second |
| Table Locks Waited | Number of table locks that had to wait. | Average | Requests per Second |
| Total Number of Deadlocks | Total number of deadlocks across the database. | Average | Count |
DB Users
| メトリック名 | 説明 | 統計 | 単位 |
|---|---|---|---|
| User Connections | Total number of user connections. | Average | Count |
| Maximum Connections | Maximum number of allowed user connections. | Average | Count |
| Aborted Clients | Number of connections aborted by clients. | Average | Count |
| Aborted Connects | Number of failed connection attempts. | Average | Count |
| Threads Running | Number of currently running threads. | Average | Count |
| Threads Created | Total number of created threads. | Average | Count |
| Threads Connected | Number of currently connected threads. | Average | Count |
OS System
| メトリック名 | 説明 | 統計 | 単位 |
|---|---|---|---|
| System Handles | Number of system handles in use. | Average | Count |
| System Processes | Number of running system processes. | Average | Count |
| System Threads | Number of active system threads. | Average | Count |
DB Access Methods
| メトリック名 | 説明 | 統計 | 単位 |
|---|---|---|---|
| Access Methods Page Splits | Number of page splits occurring in the database. | Average | Count |
| Access Methods Forwarded Records | Number of forwarded records in the database. | Average | Count |
OS Disks
| メトリック名 | 説明 | 統計 | 単位 |
|---|---|---|---|
| Available Kilobytes | Available disk space in kilobytes. | Average | KB |
| Available Percent | Available disk space as a percentage. | Average | Percentage |
| Read Bytes per Second | Disk read bytes per second. | Average | Bytes write/s |
| Read Count per Second | Disk read count per second. | Average | Count |
| Total Kilobytes | Total disk space in kilobytes. | Average | KB |
| Used Kilobytes | Used disk space in kilobytes. | Average | KB |
| Used Percent | Used disk space as a percentage. | Average | Percentage |
| Write Bytes per Second | Disk write bytes per second. | Average | Bytes write/s |
| Write Count per Second | Disk write count per second. | Average | Count |
DB Databases
| メトリック名 | 説明 | 統計 | 単位 |
|---|---|---|---|
| Total Active Transactions | Total number of active transactions. | Average | Count |
| Total Active Transactions | Total log bytes flushed. | Average | Count |
| Total Log Flush Waits | Total number of log flush waits. | Average | Count |
| Total Log Flushes | Total number of log flushes. | Average | Count |
| Total Log Flushes | Total number of write transactions. | Average | Count |
DB General Statistics
| メトリック名 | 説明 | 統計 | 単位 |
|---|---|---|---|
| Blocked Processes | Total number of processes currently blocked. | Average | |
| User Connections | Total number of user connections. | Average |
DB Latches
| メトリック名 | 説明 | 統計 | 単位 |
|---|---|---|---|
| Latch Waits | Total number of latch waits. | Average | Count |
DB Memory Manager
| メトリック名 | 説明 | 統計 | 単位 |
|---|---|---|---|
| Memory Manager Memory Grants Pending | Number of memory grants that are pending. | Average | Count |
DB SQL Statistics
| メトリック名 | 説明 | 統計 | 単位 |
|---|---|---|---|
| Batch Requests | Total number of batch requests. | Average | Count |
| SQL Compilations | Number of SQL compilations. | Average | Count |
| SQL Re-Compilations | Number of SQL re-compilations. | Average | Count |
DB Buffer Manager
| メトリック名 | 説明 | 統計 | 単位 |
|---|---|---|---|
| Page Life Expectancy | Average number of seconds a page stays in the buffer pool. | Average | Count |
| Buffer Cache Hit Ratio | Percentage of page requests satisfied by the buffer cache. | Average | Count |
| Page Lookups | Total number of page lookups. | Average | Count |
| Page Reads | Total number of pages read from disk. | Average | Count |
| Page Writes | Total number of pages written to disk. | Average | Count |
DB SQL Queries
| メトリック名 | 説明 | 統計 | 単位 |
|---|---|---|---|
| Execution Count per Second | Total number of SQL executions per second. | Average | Count per second |
| Total Elapsed Time per Second | Total elapsed time for SQL executions per second. | Average | Seconds |
| Total Rows per Second | Total number of rows processed per second. | Average | Count per second |
| Total Logical Reads per Second | Total logical reads per second. | Average | Count per second |
| Total Logical Writes per Second | Total logical writes per second. | Average | Count per second |
| Total Physical Reads per Second | Total physical reads per second. | Average | Count per second |
| Total Worker Time per Second | Total worker time per second. | Average | Count per second |
| Total Elapsed Time per Call | Total elapsed time per call. | Average | Count |
| Total Rows per Call | Total number of rows processed per call. | Average | Count |
| Total Logical Reads per Call | Total logical reads per call. | Average | Count |
| Total Logical Writes per Call | Total logical writes per call. | Average | Count |
| Total Physical Reads per Call | Total physical reads per call. | Average | Count |
| Total Worker Time per Call | Total worker time per call. | Average | Count |
| Execution Plan Count | Total number of execution plans. | Average | Count |
| Executions per Second | Total number of executions per second. | Average | Count per second |
| Elapsed Time per Second | Elapsed time per second. | Average | Count per second |
| Rows Processed per Second | Rows processed per second. | Average | Count per second |
| Buffer Gets per Second | Total buffer gets per second. | Average | Count per second |
| Physical Read Requests per Second | Total physical read requests per second. | Average | Count per second |
| Physical Write Requests per Second | Total physical write requests per second. | Average | Count per second |
| Total Sharable Memory per Second | Total sharable memory per second. | Average | Count per second |
| CPU Time per Second | CPU time used per second. | Average | Count per second |
| Elapsed Time per Execution | Elapsed time per execution. | Average | Count |
| Rows Processed per Execution | Rows processed per execution. | Average | Count |
| Buffer Gets per Execution | Buffer gets per execution. | Average | Count |
| Physical Read Requests per Execution | Physical read requests per execution. | Average | Count |
| Physical Write Requests per Execution | Physical write requests per execution. | Average | Count |
| Total Sharable Memory per Execution | Total sharable memory per execution. | Average | Count |
| CPU Time per Execution | CPU time used per execution. | Average | Count |
DB Redo
| メトリック名 | 説明 | 統計 | 単位 |
|---|---|---|---|
| Redo Size | Total size of redo logs. | Average | Bytes |
設定詳細
| 属性 | 詳細 |
|---|---|
| インスタンスID | DBインスタンスの固有識別子(ID)です。 |
| インスタンスクラス | RDS DBインスタンスのクラスです。 |
| vCPUs | DBインスタンスタイプの仮想コア数です。 |
| メモリ | RDSインスタンスタイプのメモリ容量です。 |
| 割り当てられたストレージ容量 | インスタンスタイプに割り当てられたストレージ容量です。 |
| 作成時間 | DBインスタンスが作成された時刻です。 |
| エンジン名 | DBエンジンの名前です。 |
| エンジンバージョン | 指定されたDBエンジンのデフォルトバージョンです。 |
| マスターユーザー名 | RDSデータベースマスターのユーザー名です。 |
| データベース名 | デフォルトデータベースの名前です。 |
| リージョン | DBインスタンスがデプロイされているリージョンです。 |
| アベイラビリティーゾーン | レプリカがデプロイされているアベイラビリティーゾーンです。 |
| VPC ID | DBインスタンスがデプロイされているVirtual Private Cloudの識別子(ID)です。 |
| セキュリティグループ | DBインスタンスに割り当てられているセキュリティグループの名前です。 |
| エンドポイントアドレス | データベースの接続エンドポイントです。 |
| エンドポイントポート | データベースが接続を受け付けるポート番号です。 |
| マルチデプロイ | DBインスタンスがマルチAZ配置に属しているかどうか示します。 |
| バックアップウィンドウ | DBインスタンス作成時に設定されたバックアップウィンドウです。 |
| 最新の復元可能時間 | DBインスタンスの最新の復元可能時間です。 |
| バックアップ保管期間 | DBインスタンスのバックアップ保管期間です。 |
| メンテナンスウィンドウ | DBクラスターのメンテナンスウィンドウです。 |
監視RDSインスタンスにしきい値プロファイルを追加するには、こちらのページをご確認ください。
予測
次のパフォーマンスメトリックの未来の値を推定し、AWSインフラの容量追加やスケーリングの検討に役立てられます。
- CPU使用率
- 空きストレージ容量
- 空きメモリ
- スワップ使用量
- Binログディスク使用量
- バーストバランス
- ディスクキュー長
- トランザクションログディスク使用量
- CPUクレジット使用量
- CPUクレジット残高
- CPU余剰使用量
- CPU容量残高
- Aurora Binログ
- 空きローカルストレージ
- ボリューム読み取りIOPS
- ボリューム書き込みIOPS
- メモリ使用率
監視データ
次のタブでAmazon RDS監視のデータを表示できます。
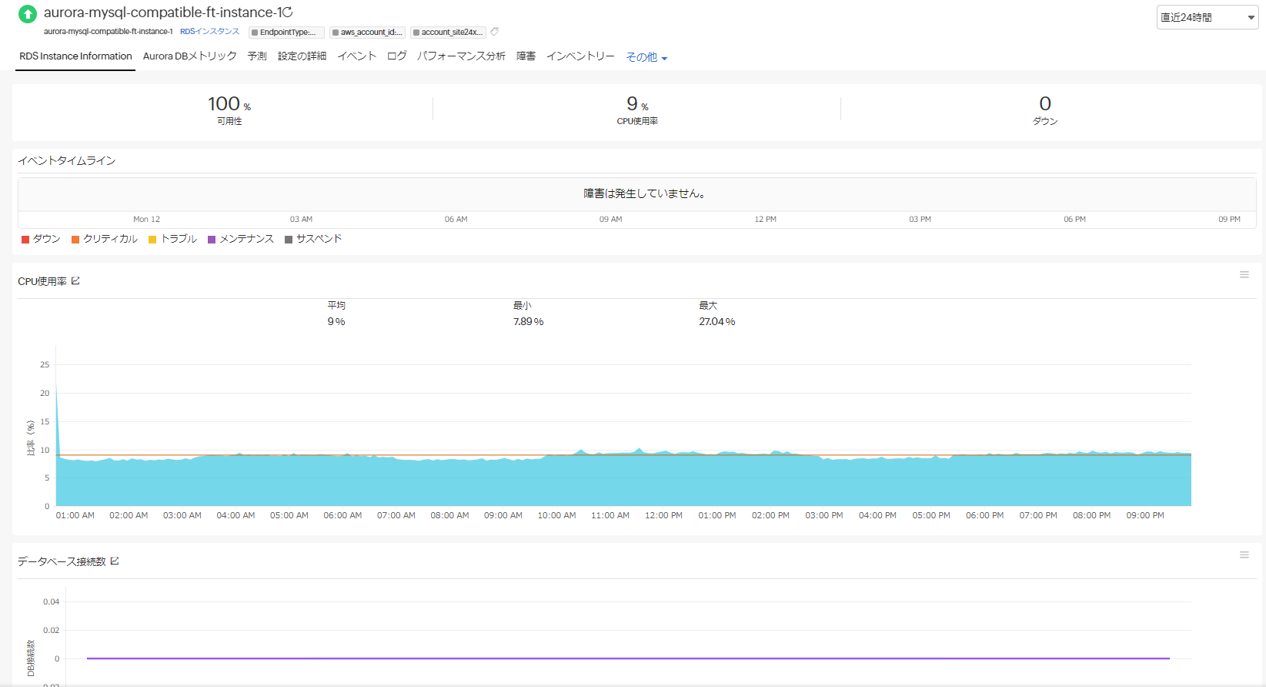
RDSインスタンス情報
グラフ形式でイベントタイムラインとメトリックの概要を表示します。
Aurora DBメトリック
Amazon RDS Auroraパラレルクエリリクエスト、転送ライターパフォーマンス、Auroraキャパシティユニット(ACU)メトリックといったAmazon RDS Auroraメトリックを表示します。
設定の詳細
インスタンスID、リージョン、インスタンスクラス、作成時間といったRDSインスタンスの情報を表示します。
イベント
バックアップ、メンテナンス、状態変更といったRDSインスタンスのアクティビティや変更情報を表示します。
ログ
AWS RDSインスタンスのエラーログの監視を行います。
パフォーマンス分析
データベースロード(DBLOAD)全体、CPU関連ロード(DBLOADCPU)、CPU未関連ロード(DBLOADNONCPU)などのAmazon RDSメトリックを表示します。
障害
障害開始時間、終了時間、期間、コメントといった情報を表示します。
インベントリー
リソース名、リージョン、監視ライセンスカテゴリーなどの情報を表示します。
しきい値と可用性のプロファイル、通知プロファイルをこのタブから編集できます。
ログレポート
RDS監視のログ状況をレポート形式で表示します。CSVファイルでダウンロードすることも可能です。